Unemployment and labour underutilization statistics describe the extent to which available labour is not fully employed. ILOSTAT presents data on unemployment and broader measures of labour underutilization used to analyse slack in labour markets across countries.
Data catalogue
|
▸
Unemployment
108 tables
|
||
| SDG indicator 8.5.2 - Unemployment rate by sex and age (%) | Annual | |
| SDG indicator 8.5.2 - Unemployment rate by sex and age -- 19th ICLS (%) | Annual | |
| SDG indicator 8.5.2 - Unemployment rate by sex and disability status (%) | Annual | |
| SDG indicator 8.5.2 - Unemployment rate by sex and disability status -- 19th ICLS (%) | Annual | |
| Unemployment by sex and age (thousands) | Annual | |
| Unemployment by sex and age (thousands) | Quarterly | |
| Unemployment by sex and age (thousands) | Monthly | |
| Unemployment by sex, age and education (thousands) | Annual | |
| Unemployment by sex, age and education (thousands) | Quarterly | |
| Unemployment by sex, age and education (thousands) | Monthly | |
| Unemployment by sex, age and rural / urban areas (thousands) | Annual | |
| Unemployment by sex, age and rural / urban areas (thousands) | Quarterly | |
| Unemployment by sex, age and rural / urban areas (thousands) | Monthly | |
| Unemployment by sex, age and marital status (thousands) | Annual | |
| Unemployment by sex, age and marital status (thousands) | Quarterly | |
| Unemployment by sex, age and disability status (thousands) | Annual | |
| Unemployment by sex and education (thousands) | Annual | |
| Unemployment by sex and education (thousands) | Quarterly | |
| Unemployment by sex and education (thousands) | Monthly | |
| Unemployment by sex, education and rural / urban areas (thousands) | Annual | |
| Unemployment by sex, education and rural / urban areas (thousands) | Quarterly | |
| Unemployment by sex, education and marital status (thousands) | Annual | |
| Unemployment by sex, education and disability status (thousands) | Annual | |
| Unemployment by sex and rural / urban areas (thousands) | Annual | |
| Unemployment by sex and rural / urban areas (thousands) | Quarterly | |
| Unemployment by sex and rural / urban areas (thousands) | Monthly | |
| Unemployment by sex, rural / urban area and marital status (thousands) | Annual | |
| Unemployment by sex, rural / urban area and marital status (thousands) | Quarterly | |
| Unemployment by sex and marital status (thousands) | Annual | |
| Unemployment by sex and marital status (thousands) | Quarterly | |
| Unemployment by sex and marital status (thousands) | Monthly | |
| Unemployment by sex, rural / urban areas and disability status (thousands) | Annual | |
| Unemployment by sex, rural / urban areas and disability status (thousands) | Quarterly | |
| Unemployment by sex and disability status (thousands) | Annual | |
| Unemployment by sex, marital status and disability status (thousands) | Annual | |
| Unemployment by sex, marital status and disability status (thousands) | Quarterly | |
| Unemployment by sex, age and duration (thousands) | Annual | |
| Unemployment by sex, age and duration (thousands) | Quarterly | |
| Unemployment by sex, age and duration (thousands) | Monthly | |
| Unemployment by sex, duration and rural / urban areas (thousands) | Annual | |
| Unemployment by sex, duration and marital status (thousands) | Annual | |
| Unemployment of previously employed persons by sex and former economic activity (thousands) | Annual | |
| Unemployment of previously employed persons by sex, former economic activity and education (thousands) | Annual | |
| Unemployment of previously employed persons by sex and former occupation (thousands) | Annual | |
| Unemployment by sex, occupation and education (thousands) | Annual | |
| Unemployment by sex and categories of unemployed persons (thousands) | Annual | |
| Unemployment by sex and categories of unemployed persons (thousands) | Quarterly | |
| Unemployment by sex and age, seasonally adjusted series (thousands) | Quarterly | |
| Unemployment by sex and age, seasonally adjusted series (thousands) | Monthly | |
| Unemployment by sex, age and duration, seasonally adjusted series (thousands) | Quarterly | |
| Unemployment rate by sex and age (%) | Annual | |
| Unemployment rate by sex and age (%) | Quarterly | |
| Unemployment rate by sex and age (%) | Monthly | |
| Unemployment rate by sex, age and education (%) | Annual | |
| Unemployment rate by sex, age and education (%) | Quarterly | |
| Unemployment rate by sex, age and education (%) | Monthly | |
| Unemployment rate by sex, age and rural / urban areas (%) | Annual | |
| Unemployment rate by sex, age and rural / urban areas (%) | Quarterly | |
| Unemployment rate by sex, age and rural / urban areas (%) | Monthly | |
| Unemployment rate by sex, age and marital status (%) | Annual | |
| Unemployment rate by sex, age and marital status (%) | Quarterly | |
| Unemployment rate by sex, age and disability status (%) | Annual | |
| Unemployment rate by sex and education (%) | Annual | |
| Unemployment rate by sex and education (%) | Quarterly | |
| Unemployment rate by sex and education (%) | Monthly | |
| Unemployment rate by sex, education and rural / urban areas (%) | Annual | |
| Unemployment rate by sex, education and rural / urban areas (%) | Quarterly | |
| Unemployment rate by sex, education and marital status (%) | Annual | |
| Unemployment rate by sex, education and disability status (%) | Annual | |
| Unemployment rate by sex and rural / urban areas (%) | Annual | |
| Unemployment rate by sex and rural / urban areas (%) | Quarterly | |
| Unemployment rate by sex and rural / urban areas (%) | Monthly | |
| Unemployment rate by sex, rural / urban area and marital status (%) | Annual | |
| Unemployment rate by sex, rural / urban area and marital status (%) | Quarterly | |
| Unemployment rate by sex, rural / urban areas and disability status (%) | Annual | |
| Unemployment rate by sex, rural / urban areas and disability status (%) | Quarterly | |
| Unemployment rate by sex and marital status (%) | Annual | |
| Unemployment rate by sex and marital status (%) | Quarterly | |
| Unemployment rate by sex and marital status (%) | Monthly | |
| Unemployment rate by sex and disability status (%) | Annual | |
| Unemployment rate by sex, marital status and disability status (%) | Annual | |
| Unemployment rate by sex, marital status and disability status (%) | Quarterly | |
| Unemployment rate by sex and age, seasonally adjusted series (%) | Quarterly | |
| Unemployment rate by sex and age, seasonally adjusted series (%) | Monthly | |
| Prime-age unemployment rate by sex, household type and presence of children (%) | Annual | |
| Prime-age unemployment rate by sex, household type and rural / urban areas (%) | Annual | |
| Youth unemployment by sex, age and education (thousands) | Annual | |
| Youth unemployment by sex, age and rural / urban areas (thousands) | Annual | |
| Youth unemployment by sex, age and school attendance status (thousands) | Annual | |
| Youth unemployment by sex, age and disability status (thousands) | Annual | |
| Youth unemployment rate by sex, age and disability status (%) | Annual | |
| Youth unemployment by sex, age and categories of unemployed persons (thousands) | Annual | |
| Youth unemployment by sex, age and duration (thousands) | Annual | |
| Youth unemployment rate by sex, age and rural / urban areas (%) | Annual | |
| Youth unemployment rate by sex, age and education (%) | Annual | |
| Youth unemployment rate by sex, age and school attendance status (%) | Annual | |
| Youth unemployment-to-population ratio by sex, age and school attendance status (%) | Annual | |
| Youth unemployment-to-population ratio by sex, age and disability status (%) | Annual | |
| Youth unemployment-to-population ratio by sex, age and rural / urban areas (%) | Annual | |
| Youth unemployment-to-population ratio by sex, age and education (%) | Annual | |
| Unemployment by sex and age -- ILO modelled estimates, Nov. 2025 (thousands) | Annual | |
| Unemployment rate by sex and age -- ILO modelled estimates, Nov. 2025 (%) | Annual | |
| Unemployment by sex and age -- 19th ICLS (thousands) | Annual | |
| Unemployment by sex and age -- 19th ICLS (thousands) | Quarterly | |
| Unemployment rate by sex and disability status -- 19th ICLS (%) | Annual | |
| Unemployment rate by sex and disability status -- 19th ICLS (%) | Quarterly | |
| Unemployment rate by sex and age -- 19th ICLS (%) | Annual | |
| Unemployment rate by sex and age -- 19th ICLS (%) | Quarterly | |
|
▸
Other measures of labour underutilization
244 tables
|
||
| SDG indicator 8.6.1 - Proportion of youth (aged 15-24 years) not in education, employment or training by sex (%) | Annual | |
| Combined rate of time-related underemployment and unemployment (LU2) by sex and age (%) | Annual | |
| Combined rate of time-related underemployment and unemployment (LU2) by sex and age (%) | Quarterly | |
| Combined rate of time-related underemployment and unemployment (LU2) by sex and age (%) | Monthly | |
| Combined rate of time-related underemployment and unemployment (LU2) by sex, age and education (%) | Annual | |
| Combined rate of time-related underemployment and unemployment (LU2) by sex, age and education (%) | Quarterly | |
| Combined rate of time-related underemployment and unemployment (LU2) by sex, age and rural / urban areas (%) | Annual | |
| Combined rate of time-related underemployment and unemployment (LU2) by sex, age and rural / urban areas (%) | Quarterly | |
| Combined rate of time-related underemployment and unemployment (LU2) by sex, age and marital status (%) | Annual | |
| Combined rate of time-related underemployment and unemployment (LU2) by sex, age and marital status (%) | Quarterly | |
| Combined rate of time-related underemployment and unemployment (LU2) by sex and education (%) | Annual | |
| Combined rate of time-related underemployment and unemployment (LU2) by sex and education (%) | Quarterly | |
| Combined rate of time-related underemployment and unemployment (LU2) by sex, education and rural / urban areas (%) | Annual | |
| Combined rate of time-related underemployment and unemployment (LU2) by sex, education and rural / urban areas (%) | Quarterly | |
| Combined rate of time-related underemployment and unemployment (LU2) by sex, education and marital status (%) | Annual | |
| Combined rate of time-related underemployment and unemployment (LU2) by sex, education and marital status (%) | Quarterly | |
| Combined rate of time-related underemployment and unemployment (LU2) by sex and rural / urban areas (%) | Annual | |
| Combined rate of time-related underemployment and unemployment (LU2) by sex and rural / urban areas (%) | Quarterly | |
| Combined rate of time-related underemployment and unemployment (LU2) by sex, rural / urban area and marital status (%) | Annual | |
| Combined rate of time-related underemployment and unemployment (LU2) by sex, rural / urban area and marital status (%) | Quarterly | |
| Combined rate of time-related underemployment and unemployment (LU2) by sex and marital status (%) | Annual | |
| Combined rate of time-related underemployment and unemployment (LU2) by sex and marital status (%) | Quarterly | |
| Combined rate of time-related underemployment and unemployment (LU2) by sex and disability status (%) | Annual | |
| Prime-age combined rate of time-related underemployment and unemployment (LU2) by sex, household type and presence of children (%) | Annual | |
| Prime-age combined rate of time-related underemployment and unemployment (LU2) by sex, household type and rural / urban areas (%) | Annual | |
| Combined rate of unemployment and potential labour force (LU3) by sex and age (%) | Annual | |
| Combined rate of unemployment and potential labour force (LU3) by sex and age (%) | Quarterly | |
| Combined rate of unemployment and potential labour force (LU3) by sex and age (%) | Monthly | |
| Combined rate of unemployment and potential labour force (LU3) by sex, age and education (%) | Annual | |
| Combined rate of unemployment and potential labour force (LU3) by sex, age and education (%) | Quarterly | |
| Combined rate of unemployment and potential labour force (LU3) by sex, age and rural / urban areas (%) | Annual | |
| Combined rate of unemployment and potential labour force (LU3) by sex, age and rural / urban areas (%) | Quarterly | |
| Combined rate of unemployment and potential labour force (LU3) by sex, age and marital status (%) | Annual | |
| Combined rate of unemployment and potential labour force (LU3) by sex, age and marital status (%) | Quarterly | |
| Combined rate of unemployment and potential labour force (LU3) by sex and education (%) | Annual | |
| Combined rate of unemployment and potential labour force (LU3) by sex and education (%) | Quarterly | |
| Combined rate of unemployment and potential labour force (LU3) by sex, education and rural / urban areas (%) | Annual | |
| Combined rate of unemployment and potential labour force (LU3) by sex, education and rural / urban areas (%) | Quarterly | |
| Combined rate of unemployment and potential labour force (LU3) by sex, education and marital status (%) | Annual | |
| Combined rate of unemployment and potential labour force (LU3) by sex, education and marital status (%) | Quarterly | |
| Combined rate of unemployment and potential labour force (LU3) by sex and rural / urban areas (%) | Annual | |
| Combined rate of unemployment and potential labour force (LU3) by sex and rural / urban areas (%) | Quarterly | |
| Combined rate of unemployment and potential labour force (LU3) by sex, rural / urban area and marital status (%) | Annual | |
| Combined rate of unemployment and potential labour force (LU3) by sex, rural / urban area and marital status (%) | Quarterly | |
| Combined rate of unemployment and potential labour force (LU3) by sex and marital status (%) | Annual | |
| Combined rate of unemployment and potential labour force (LU3) by sex and marital status (%) | Quarterly | |
| Combined rate of unemployment and potential labour force (LU3) by sex and disability status (%) | Annual | |
| Prime-age combined rate of unemployment and potential labour force (LU3) by sex, household type and presence of children (%) | Annual | |
| Prime-age combined rate of unemployment and potential labour force (LU3) by sex, household type and rural / urban areas (%) | Annual | |
| Composite rate of labour underutilization (LU4) by sex and age (%) | Annual | |
| Composite rate of labour underutilization (LU4) by sex and age (%) | Quarterly | |
| Composite rate of labour underutilization (LU4) by sex and age (%) | Monthly | |
| Composite rate of labour underutilization (LU4) by sex, age and education (%) | Annual | |
| Composite rate of labour underutilization (LU4) by sex, age and education (%) | Quarterly | |
| Composite rate of labour underutilization (LU4) by sex, age and rural / urban areas (%) | Annual | |
| Composite rate of labour underutilization (LU4) by sex, age and rural / urban areas (%) | Quarterly | |
| Composite rate of labour underutilization (LU4) by sex, age and marital status (%) | Annual | |
| Composite rate of labour underutilization (LU4) by sex, age and marital status (%) | Quarterly | |
| Composite rate of labour underutilization (LU4) by sex and education (%) | Annual | |
| Composite rate of labour underutilization (LU4) by sex and education (%) | Quarterly | |
| Composite rate of labour underutilization (LU4) by sex, education and rural / urban areas (%) | Annual | |
| Composite rate of labour underutilization (LU4) by sex, education and rural / urban areas (%) | Quarterly | |
| Composite rate of labour underutilization (LU4) by sex, education and marital status (%) | Annual | |
| Composite rate of labour underutilization (LU4) by sex, education and marital status (%) | Quarterly | |
| Composite rate of labour underutilization (LU4) by sex and rural / urban areas (%) | Annual | |
| Composite rate of labour underutilization (LU4) by sex and rural / urban areas (%) | Quarterly | |
| Composite rate of labour underutilization (LU4) by sex, rural / urban area and marital status (%) | Annual | |
| Composite rate of labour underutilization (LU4) by sex, rural / urban area and marital status (%) | Quarterly | |
| Composite rate of labour underutilization (LU4) by sex and marital status (%) | Annual | |
| Composite rate of labour underutilization (LU4) by sex and marital status (%) | Quarterly | |
| Composite rate of labour underutilization (LU4) by sex and disability status (%) | Annual | |
| Prime-age composite rate of labour underutilization (LU4) by sex, household type and presence of children (%) | Annual | |
| Prime-age composite rate of labour underutilization (LU4) by sex, household type and rural / urban areas (%) | Annual | |
| Jobs gap (thousands) | Annual | |
| Jobs gap rate (%) | Annual | |
| Discouraged job-seekers by sex and age (thousands) | Annual | |
| Discouraged job-seekers by sex and age (thousands) | Quarterly | |
| Discouraged job-seekers by sex and age (thousands) | Monthly | |
| Discouraged job-seekers by sex, age and education (thousands) | Annual | |
| Discouraged job-seekers by sex, age and education (thousands) | Quarterly | |
| Discouraged job-seekers by sex, age and rural / urban areas (thousands) | Annual | |
| Discouraged job-seekers by sex, age and rural / urban areas (thousands) | Quarterly | |
| Discouraged job-seekers by sex, age and marital status (thousands) | Annual | |
| Discouraged job-seekers by sex, age and marital status (thousands) | Quarterly | |
| Discouraged job-seekers by sex and education (thousands) | Annual | |
| Discouraged job-seekers by sex and education (thousands) | Quarterly | |
| Discouraged job-seekers by sex, education and rural / urban areas (thousands) | Annual | |
| Discouraged job-seekers by sex, education and rural / urban areas (thousands) | Quarterly | |
| Discouraged job-seekers by sex, education and marital status (thousands) | Annual | |
| Discouraged job-seekers by sex, education and marital status (thousands) | Quarterly | |
| Discouraged job-seekers by sex and rural / urban areas (thousands) | Annual | |
| Discouraged job-seekers by sex and rural / urban areas (thousands) | Quarterly | |
| Discouraged job-seekers by sex, rural / urban area and marital status (thousands) | Annual | |
| Discouraged job-seekers by sex, rural / urban area and marital status (thousands) | Quarterly | |
| Discouraged job-seekers by sex and marital status (thousands) | Annual | |
| Discouraged job-seekers by sex and marital status (thousands) | Quarterly | |
| Discouraged job-seekers by sex and disability status (thousands) | Annual | |
| Potential labour force by sex and age (thousands) | Annual | |
| Potential labour force by sex and age (thousands) | Quarterly | |
| Potential labour force by sex and age (thousands) | Monthly | |
| Potential labour force by sex, age and education (thousands) | Annual | |
| Potential labour force by sex, age and education (thousands) | Quarterly | |
| Potential labour force by sex, age and rural / urban areas (thousands) | Annual | |
| Potential labour force by sex, age and rural / urban areas (thousands) | Quarterly | |
| Potential labour force by sex, age and marital status (thousands) | Annual | |
| Potential labour force by sex, age and marital status (thousands) | Quarterly | |
| Potential labour force by sex and education (thousands) | Annual | |
| Potential labour force by sex and education (thousands) | Quarterly | |
| Potential labour force by sex, education and rural / urban areas (thousands) | Annual | |
| Potential labour force by sex, education and rural / urban areas (thousands) | Quarterly | |
| Potential labour force by sex, education and marital status (thousands) | Annual | |
| Potential labour force by sex, education and marital status (thousands) | Quarterly | |
| Potential labour force by sex and rural / urban areas (thousands) | Annual | |
| Potential labour force by sex and rural / urban areas (thousands) | Quarterly | |
| Potential labour force by sex, rural / urban area and marital status (thousands) | Annual | |
| Potential labour force by sex, rural / urban area and marital status (thousands) | Quarterly | |
| Potential labour force by sex and marital status (thousands) | Annual | |
| Potential labour force by sex and marital status (thousands) | Quarterly | |
| Potential labour force by sex and disability status (thousands) | Annual | |
| Potential labour force and willing non-jobseekers (thousands) | Annual | |
| Persons outside the labour force by sex and age (thousands) | Annual | |
| Persons outside the labour force by sex and age (thousands) | Quarterly | |
| Persons outside the labour force by sex and age (thousands) | Monthly | |
| Persons outside the labour force by sex, age and education (thousands) | Annual | |
| Persons outside the labour force by sex, age and education (thousands) | Quarterly | |
| Persons outside the labour force by sex, age and education (thousands) | Monthly | |
| Persons outside the labour force by sex, age and rural / urban areas (thousands) | Annual | |
| Persons outside the labour force by sex, age and rural / urban areas (thousands) | Quarterly | |
| Persons outside the labour force by sex, age and rural / urban areas (thousands) | Monthly | |
| Persons outside the labour force by sex, age and marital status (thousands) | Annual | |
| Persons outside the labour force by sex, age and marital status (thousands) | Quarterly | |
| Persons outside the labour force by sex, age and disability status (thousands) | Annual | |
| Persons outside the labour force by sex and education (thousands) | Annual | |
| Persons outside the labour force by sex and education (thousands) | Quarterly | |
| Persons outside the labour force by sex and education (thousands) | Monthly | |
| Persons outside the labour force by sex, education and rural / urban areas (thousands) | Annual | |
| Persons outside the labour force by sex, education and rural / urban areas (thousands) | Quarterly | |
| Persons outside the labour force by sex, education and marital status (thousands) | Annual | |
| Persons outside the labour force by sex, education and marital status (thousands) | Quarterly | |
| Persons outside the labour force by sex, education and disability status (thousands) | Annual | |
| Persons outside the labour force by sex and rural / urban areas (thousands) | Annual | |
| Persons outside the labour force by sex and rural / urban areas (thousands) | Quarterly | |
| Persons outside the labour force by sex and rural / urban areas (thousands) | Monthly | |
| Persons outside the labour force by sex, rural / urban area and marital status (thousands) | Annual | |
| Persons outside the labour force by sex, rural / urban area and marital status (thousands) | Quarterly | |
| Persons outside the labour force by sex, rural / urban areas and disability status (thousands) | Annual | |
| Persons outside the labour force by sex, rural / urban areas and disability status (thousands) | Quarterly | |
| Persons outside the labour force by sex and marital status (thousands) | Annual | |
| Persons outside the labour force by sex and marital status (thousands) | Quarterly | |
| Persons outside the labour force by sex and marital status (thousands) | Monthly | |
| Persons outside the labour force by sex, marital status and disability status (thousands) | Annual | |
| Persons outside the labour force by sex, marital status and disability status (thousands) | Quarterly | |
| Persons outside the labour force by sex and disability status (thousands) | Annual | |
| Persons outside the labour force by sex and disability status (thousands) | Quarterly | |
| Potential labour force and willing non-jobseekers rate (%) | Annual | |
| Inactivity rate by sex and age (%) | Annual | |
| Inactivity rate by sex and age (%) | Quarterly | |
| Inactivity rate by sex and age (%) | Monthly | |
| Inactivity rate by sex, age and education (%) | Annual | |
| Inactivity rate by sex, age and education (%) | Quarterly | |
| Inactivity rate by sex, age and education (%) | Monthly | |
| Inactivity rate by sex, age and rural / urban areas (%) | Annual | |
| Inactivity rate by sex, age and rural / urban areas (%) | Quarterly | |
| Inactivity rate by sex, age and rural / urban areas (%) | Monthly | |
| Inactivity rate by sex, age and marital status (%) | Annual | |
| Inactivity rate by sex, age and marital status (%) | Quarterly | |
| Inactivity rate by sex, age and disability status (%) | Annual | |
| Inactivity rate by sex and education (%) | Annual | |
| Inactivity rate by sex and education (%) | Quarterly | |
| Inactivity rate by sex and education (%) | Monthly | |
| Inactivity rate by sex, education and rural / urban areas (%) | Annual | |
| Inactivity rate by sex, education and rural / urban areas (%) | Quarterly | |
| Inactivity rate by sex, education and marital status (%) | Annual | |
| Inactivity rate by sex, education and disability status (%) | Annual | |
| Inactivity rate by sex and rural / urban areas (%) | Annual | |
| Inactivity rate by sex and rural / urban areas (%) | Quarterly | |
| Inactivity rate by sex and rural / urban areas (%) | Monthly | |
| Inactivity rate by sex, rural / urban area and marital status (%) | Annual | |
| Inactivity rate by sex, rural / urban area and marital status (%) | Quarterly | |
| Inactivity rate by sex, rural / urban areas and disability status (%) | Annual | |
| Inactivity rate by sex, rural / urban areas and disability status (%) | Quarterly | |
| Inactivity rate by sex and marital status (%) | Annual | |
| Inactivity rate by sex and marital status (%) | Quarterly | |
| Inactivity rate by sex and marital status (%) | Monthly | |
| Inactivity rate by sex, marital status and disability status (%) | Annual | |
| Inactivity rate by sex, marital status and disability status (%) | Quarterly | |
| Inactivity rate by sex and disability status (%) | Annual | |
| Share of persons outside the labour force due to care responsibilities by sex (%) | Annual | |
| Share of persons outside the labour force due to care responsibilities by sex and age (%) | Annual | |
| Share of persons outside the labour force due to care responsibilities by sex and education (%) | Annual | |
| Share of persons outside the labour force due to care responsibilities by sex and rural / urban areas (%) | Annual | |
| Youth not in employment, education or training (NEET) by sex (thousands) | Annual | |
| Youth not in employment, education or training (NEET) by sex (thousands) | Quarterly | |
| Youth not in employment, education or training (NEET) by sex and age (thousands) | Annual | |
| Youth not in employment, education or training (NEET) by sex and rural / urban areas (thousands) | Annual | |
| Youth not in employment, education or training (NEET) by sex and education (thousands) | Annual | |
| Youth not in employment, education or training (NEET) by sex and marital status (thousands) | Annual | |
| Youth not in employment, education or training (NEET) by sex and disability status (thousands) | Annual | |
| Share of youth not in employment, education or training (NEET) by sex (%) | Annual | |
| Share of youth not in employment, education or training (NEET) by sex (%) | Quarterly | |
| Share of youth not in employment, education or training (NEET) by sex and age (%) | Annual | |
| Share of youth not in employment, education or training (NEET) by sex and rural / urban areas (%) | Annual | |
| Share of youth not in employment, education or training (NEET) by sex and education (%) | Annual | |
| Share of youth not in employment, education or training (NEET) by sex and marital status (%) | Annual | |
| Share of youth not in employment, education or training (NEET) by sex and disability status (%) | Annual | |
| Youth outside the labour force by sex, age and rural / urban areas (thousands) | Annual | |
| Youth outside the labour force by sex, age and education (thousands) | Annual | |
| Youth outside the labour force by sex, age and school attendance status (thousands) | Annual | |
| Youth outside the labour force by sex, age and disability status (thousands) | Annual | |
| Youth discouraged job-seekers by sex, age and rural / urban areas (thousands) | Annual | |
| Youth inactivity rate by sex, age and rural / urban areas (%) | Annual | |
| Youth inactivity rate by sex, age and education (%) | Annual | |
| Youth inactivity rate by sex, age and school attendance status (%) | Annual | |
| Youth inactivity rate by sex, age and disability status (%) | Annual | |
| Combined rate of time-related underemployment and unemployment (LU2) by sex and age -- ILO modelled estimates, Nov. 2025 (%) | Annual | |
| Combined rate of unemployment and potential labour force (LU3) by sex -- ILO modelled estimates, Nov. 2025 (%) | Annual | |
| Composite measure of labour underutilization (LU4) by sex -- ILO modelled estimates, Nov. 2025 (thousands) | Annual | |
| Composite rate of labour underutilization (LU4) by sex -- ILO modelled estimates, Nov. 2025 (%) | Annual | |
| Jobs gap by sex -- ILO modelled estimates, Nov. 2025 (thousands) | Annual | |
| Jobs gap rate by sex -- ILO modelled estimates, Nov. 2025 (%) | Annual | |
| Potential labour force by sex -- ILO modelled estimates, Nov. 2025 (thousands) | Annual | |
| Potential labour force rate by sex -- ILO modelled estimates, Nov. 2025 (%) | Annual | |
| Potential labour force and willing non-jobseekers by sex -- ILO modelled estimates, Nov. 2025 (thousands) | Annual | |
| Potential labour force and willing non-jobseekers rate -- ILO modelled estimates, Nov. 2025 (%) | Annual | |
| Persons outside the labour force by sex and age -- ILO modelled estimates, Nov. 2025 (thousands) | Annual | |
| Youth not in employment, education or training (NEET) by sex -- ILO modelled estimates, Nov. 2025 (thousands) | Annual | |
| Inactivity rate by sex and age -- ILO modelled estimates, Nov. 2025 (%) | Annual | |
| Share of youth not in employment, education or training (NEET) by sex -- ILO modelled estimates, Nov. 2025 (%) | Annual | |
| Combined rate of time-related underemployment and unemployment (LU2) by sex and age -- 19th ICLS (%) | Annual | |
| Combined rate of time-related underemployment and unemployment (LU2) by sex and age -- 19th ICLS (%) | Quarterly | |
| Combined rate of unemployment and potential labour force (LU3) by sex and age -- 19th ICLS (%) | Annual | |
| Combined rate of unemployment and potential labour force (LU3) by sex and age -- 19th ICLS (%) | Quarterly | |
| Composite rate of labour underutilization (LU4) by sex and age -- 19th ICLS (%) | Annual | |
| Composite rate of labour underutilization (LU4) by sex and age -- 19th ICLS (%) | Quarterly | |
| Potential labour force by sex and age -- 19th ICLS (thousands) | Annual | |
| Potential labour force by sex and age -- 19th ICLS (thousands) | Quarterly | |
| Persons outside the labour force by sex and age -- 19th ICLS (thousands) | Annual | |
| Persons outside the labour force by sex and age -- 19th ICLS (thousands) | Quarterly | |
| Inactivity rate by sex and age -- 19th ICLS (%) | Annual | |
| Inactivity rate by sex and age -- 19th ICLS (%) | Quarterly | |
| Youth not in employment, education or training (NEET) by sex -- 19th ICLS (thousands) | Annual | |
| Youth not in employment, education or training (NEET) by sex -- 19th ICLS (thousands) | Quarterly | |
| Share of youth not in employment, education or training (NEET) by sex -- 19th ICLS (%) | Annual | |
| Share of youth not in employment, education or training (NEET) by sex -- 19th ICLS (%) | Quarterly | |
|
▸
SDG Labour Market Indicators (ILOSDG)
5 tables
|
||
| SDG indicator 8.5.2 - Unemployment rate by sex and age (%) | Annual | |
| SDG indicator 8.5.2 - Unemployment rate by sex and age -- 19th ICLS (%) | Annual | |
| SDG indicator 8.5.2 - Unemployment rate by sex and disability status (%) | Annual | |
| SDG indicator 8.5.2 - Unemployment rate by sex and disability status -- 19th ICLS (%) | Annual | |
| SDG indicator 8.6.1 - Proportion of youth (aged 15-24 years) not in education, employment or training by sex (%) | Annual | |
|
▸
Labour Force Statistics (LFS)
47 tables
|
||
| Unemployment by sex and age (thousands) | Annual | |
| Unemployment by sex and age (thousands) | Quarterly | |
| Unemployment by sex and age (thousands) | Monthly | |
| Unemployment by sex, age and duration (thousands) | Annual | |
| Unemployment by sex, age and duration (thousands) | Quarterly | |
| Unemployment by sex, age and duration (thousands) | Monthly | |
| Unemployment of previously employed persons by sex and former economic activity (thousands) | Annual | |
| Unemployment of previously employed persons by sex and former occupation (thousands) | Annual | |
| Unemployment by sex and categories of unemployed persons (thousands) | Annual | |
| Unemployment by sex and categories of unemployed persons (thousands) | Quarterly | |
| Unemployment by sex and age, seasonally adjusted series (thousands) | Quarterly | |
| Unemployment by sex and age, seasonally adjusted series (thousands) | Monthly | |
| Unemployment by sex, age and duration, seasonally adjusted series (thousands) | Quarterly | |
| Unemployment rate by sex and age (%) | Annual | |
| Unemployment rate by sex and age (%) | Quarterly | |
| Unemployment rate by sex and age (%) | Monthly | |
| Combined rate of time-related underemployment and unemployment (LU2) by sex and age (%) | Annual | |
| Combined rate of time-related underemployment and unemployment (LU2) by sex and age (%) | Quarterly | |
| Combined rate of time-related underemployment and unemployment (LU2) by sex and age (%) | Monthly | |
| Combined rate of unemployment and potential labour force (LU3) by sex and age (%) | Annual | |
| Combined rate of unemployment and potential labour force (LU3) by sex and age (%) | Quarterly | |
| Combined rate of unemployment and potential labour force (LU3) by sex and age (%) | Monthly | |
| Composite rate of labour underutilization (LU4) by sex and age (%) | Annual | |
| Composite rate of labour underutilization (LU4) by sex and age (%) | Quarterly | |
| Composite rate of labour underutilization (LU4) by sex and age (%) | Monthly | |
| Jobs gap (thousands) | Annual | |
| Jobs gap rate (%) | Annual | |
| Discouraged job-seekers by sex and age (thousands) | Annual | |
| Discouraged job-seekers by sex and age (thousands) | Quarterly | |
| Discouraged job-seekers by sex and age (thousands) | Monthly | |
| Potential labour force by sex and age (thousands) | Annual | |
| Potential labour force by sex and age (thousands) | Quarterly | |
| Potential labour force by sex and age (thousands) | Monthly | |
| Potential labour force and willing non-jobseekers (thousands) | Annual | |
| Persons outside the labour force by sex and age (thousands) | Annual | |
| Persons outside the labour force by sex and age (thousands) | Quarterly | |
| Persons outside the labour force by sex and age (thousands) | Monthly | |
| Potential labour force and willing non-jobseekers rate (%) | Annual | |
| Inactivity rate by sex and age (%) | Annual | |
| Inactivity rate by sex and age (%) | Quarterly | |
| Inactivity rate by sex and age (%) | Monthly | |
| Youth not in employment, education or training (NEET) by sex (thousands) | Annual | |
| Youth not in employment, education or training (NEET) by sex (thousands) | Quarterly | |
| Youth not in employment, education or training (NEET) by sex and age (thousands) | Annual | |
| Share of youth not in employment, education or training (NEET) by sex (%) | Annual | |
| Share of youth not in employment, education or training (NEET) by sex (%) | Quarterly | |
| Share of youth not in employment, education or training (NEET) by sex and age (%) | Annual | |
|
▸
ILO Modelled Estimates (ILOEST)
16 tables
|
||
| Unemployment by sex and age -- ILO modelled estimates, Nov. 2025 (thousands) | Annual | |
| Unemployment rate by sex and age -- ILO modelled estimates, Nov. 2025 (%) | Annual | |
| Combined rate of time-related underemployment and unemployment (LU2) by sex and age -- ILO modelled estimates, Nov. 2025 (%) | Annual | |
| Combined rate of unemployment and potential labour force (LU3) by sex -- ILO modelled estimates, Nov. 2025 (%) | Annual | |
| Composite measure of labour underutilization (LU4) by sex -- ILO modelled estimates, Nov. 2025 (thousands) | Annual | |
| Composite rate of labour underutilization (LU4) by sex -- ILO modelled estimates, Nov. 2025 (%) | Annual | |
| Jobs gap by sex -- ILO modelled estimates, Nov. 2025 (thousands) | Annual | |
| Jobs gap rate by sex -- ILO modelled estimates, Nov. 2025 (%) | Annual | |
| Potential labour force by sex -- ILO modelled estimates, Nov. 2025 (thousands) | Annual | |
| Potential labour force rate by sex -- ILO modelled estimates, Nov. 2025 (%) | Annual | |
| Potential labour force and willing non-jobseekers by sex -- ILO modelled estimates, Nov. 2025 (thousands) | Annual | |
| Potential labour force and willing non-jobseekers rate -- ILO modelled estimates, Nov. 2025 (%) | Annual | |
| Persons outside the labour force by sex and age -- ILO modelled estimates, Nov. 2025 (thousands) | Annual | |
| Youth not in employment, education or training (NEET) by sex -- ILO modelled estimates, Nov. 2025 (thousands) | Annual | |
| Inactivity rate by sex and age -- ILO modelled estimates, Nov. 2025 (%) | Annual | |
| Share of youth not in employment, education or training (NEET) by sex -- ILO modelled estimates, Nov. 2025 (%) | Annual | |
|
▸
Work Statistics 19th ICLS (WORK)
22 tables
|
||
| Unemployment by sex and age -- 19th ICLS (thousands) | Annual | |
| Unemployment by sex and age -- 19th ICLS (thousands) | Quarterly | |
| Unemployment rate by sex and disability status -- 19th ICLS (%) | Annual | |
| Unemployment rate by sex and disability status -- 19th ICLS (%) | Quarterly | |
| Unemployment rate by sex and age -- 19th ICLS (%) | Annual | |
| Unemployment rate by sex and age -- 19th ICLS (%) | Quarterly | |
| Combined rate of time-related underemployment and unemployment (LU2) by sex and age -- 19th ICLS (%) | Annual | |
| Combined rate of time-related underemployment and unemployment (LU2) by sex and age -- 19th ICLS (%) | Quarterly | |
| Combined rate of unemployment and potential labour force (LU3) by sex and age -- 19th ICLS (%) | Annual | |
| Combined rate of unemployment and potential labour force (LU3) by sex and age -- 19th ICLS (%) | Quarterly | |
| Composite rate of labour underutilization (LU4) by sex and age -- 19th ICLS (%) | Annual | |
| Composite rate of labour underutilization (LU4) by sex and age -- 19th ICLS (%) | Quarterly | |
| Potential labour force by sex and age -- 19th ICLS (thousands) | Annual | |
| Potential labour force by sex and age -- 19th ICLS (thousands) | Quarterly | |
| Persons outside the labour force by sex and age -- 19th ICLS (thousands) | Annual | |
| Persons outside the labour force by sex and age -- 19th ICLS (thousands) | Quarterly | |
| Inactivity rate by sex and age -- 19th ICLS (%) | Annual | |
| Inactivity rate by sex and age -- 19th ICLS (%) | Quarterly | |
| Youth not in employment, education or training (NEET) by sex -- 19th ICLS (thousands) | Annual | |
| Youth not in employment, education or training (NEET) by sex -- 19th ICLS (thousands) | Quarterly | |
| Share of youth not in employment, education or training (NEET) by sex -- 19th ICLS (%) | Annual | |
| Share of youth not in employment, education or training (NEET) by sex -- 19th ICLS (%) | Quarterly | |
|
▸
Youth Labour Market Indicators (YouthSTATS)
23 tables
|
||
| Youth unemployment by sex, age and education (thousands) | Annual | |
| Youth unemployment by sex, age and rural / urban areas (thousands) | Annual | |
| Youth unemployment by sex, age and school attendance status (thousands) | Annual | |
| Youth unemployment by sex, age and disability status (thousands) | Annual | |
| Youth unemployment rate by sex, age and disability status (%) | Annual | |
| Youth unemployment by sex, age and categories of unemployed persons (thousands) | Annual | |
| Youth unemployment by sex, age and duration (thousands) | Annual | |
| Youth unemployment rate by sex, age and rural / urban areas (%) | Annual | |
| Youth unemployment rate by sex, age and education (%) | Annual | |
| Youth unemployment rate by sex, age and school attendance status (%) | Annual | |
| Youth unemployment-to-population ratio by sex, age and school attendance status (%) | Annual | |
| Youth unemployment-to-population ratio by sex, age and disability status (%) | Annual | |
| Youth unemployment-to-population ratio by sex, age and rural / urban areas (%) | Annual | |
| Youth unemployment-to-population ratio by sex, age and education (%) | Annual | |
| Youth outside the labour force by sex, age and rural / urban areas (thousands) | Annual | |
| Youth outside the labour force by sex, age and education (thousands) | Annual | |
| Youth outside the labour force by sex, age and school attendance status (thousands) | Annual | |
| Youth outside the labour force by sex, age and disability status (thousands) | Annual | |
| Youth discouraged job-seekers by sex, age and rural / urban areas (thousands) | Annual | |
| Youth inactivity rate by sex, age and rural / urban areas (%) | Annual | |
| Youth inactivity rate by sex, age and education (%) | Annual | |
| Youth inactivity rate by sex, age and school attendance status (%) | Annual | |
| Youth inactivity rate by sex, age and disability status (%) | Annual | |
|
▸
Gender Equality and Non-Discrimination Indicators (GEND)
55 tables
|
||
| Unemployment by sex, age and marital status (thousands) | Annual | |
| Unemployment by sex, age and marital status (thousands) | Quarterly | |
| Unemployment by sex and marital status (thousands) | Annual | |
| Unemployment by sex and marital status (thousands) | Quarterly | |
| Unemployment by sex and marital status (thousands) | Monthly | |
| Unemployment by sex, duration and marital status (thousands) | Annual | |
| Unemployment rate by sex, age and marital status (%) | Annual | |
| Unemployment rate by sex, age and marital status (%) | Quarterly | |
| Unemployment rate by sex and marital status (%) | Annual | |
| Unemployment rate by sex and marital status (%) | Quarterly | |
| Unemployment rate by sex and marital status (%) | Monthly | |
| Prime-age unemployment rate by sex, household type and presence of children (%) | Annual | |
| Prime-age unemployment rate by sex, household type and rural / urban areas (%) | Annual | |
| Combined rate of time-related underemployment and unemployment (LU2) by sex, age and marital status (%) | Annual | |
| Combined rate of time-related underemployment and unemployment (LU2) by sex, age and marital status (%) | Quarterly | |
| Combined rate of time-related underemployment and unemployment (LU2) by sex and marital status (%) | Annual | |
| Combined rate of time-related underemployment and unemployment (LU2) by sex and marital status (%) | Quarterly | |
| Prime-age combined rate of time-related underemployment and unemployment (LU2) by sex, household type and presence of children (%) | Annual | |
| Prime-age combined rate of time-related underemployment and unemployment (LU2) by sex, household type and rural / urban areas (%) | Annual | |
| Combined rate of unemployment and potential labour force (LU3) by sex, age and marital status (%) | Annual | |
| Combined rate of unemployment and potential labour force (LU3) by sex, age and marital status (%) | Quarterly | |
| Combined rate of unemployment and potential labour force (LU3) by sex and marital status (%) | Annual | |
| Combined rate of unemployment and potential labour force (LU3) by sex and marital status (%) | Quarterly | |
| Prime-age combined rate of unemployment and potential labour force (LU3) by sex, household type and presence of children (%) | Annual | |
| Prime-age combined rate of unemployment and potential labour force (LU3) by sex, household type and rural / urban areas (%) | Annual | |
| Composite rate of labour underutilization (LU4) by sex, age and marital status (%) | Annual | |
| Composite rate of labour underutilization (LU4) by sex, age and marital status (%) | Quarterly | |
| Composite rate of labour underutilization (LU4) by sex and marital status (%) | Annual | |
| Composite rate of labour underutilization (LU4) by sex and marital status (%) | Quarterly | |
| Prime-age composite rate of labour underutilization (LU4) by sex, household type and presence of children (%) | Annual | |
| Prime-age composite rate of labour underutilization (LU4) by sex, household type and rural / urban areas (%) | Annual | |
| Discouraged job-seekers by sex, age and marital status (thousands) | Annual | |
| Discouraged job-seekers by sex, age and marital status (thousands) | Quarterly | |
| Discouraged job-seekers by sex and marital status (thousands) | Annual | |
| Discouraged job-seekers by sex and marital status (thousands) | Quarterly | |
| Potential labour force by sex, age and marital status (thousands) | Annual | |
| Potential labour force by sex, age and marital status (thousands) | Quarterly | |
| Potential labour force by sex and marital status (thousands) | Annual | |
| Potential labour force by sex and marital status (thousands) | Quarterly | |
| Persons outside the labour force by sex, age and marital status (thousands) | Annual | |
| Persons outside the labour force by sex, age and marital status (thousands) | Quarterly | |
| Persons outside the labour force by sex and marital status (thousands) | Annual | |
| Persons outside the labour force by sex and marital status (thousands) | Quarterly | |
| Persons outside the labour force by sex and marital status (thousands) | Monthly | |
| Inactivity rate by sex, age and marital status (%) | Annual | |
| Inactivity rate by sex, age and marital status (%) | Quarterly | |
| Inactivity rate by sex and marital status (%) | Annual | |
| Inactivity rate by sex and marital status (%) | Quarterly | |
| Inactivity rate by sex and marital status (%) | Monthly | |
| Share of persons outside the labour force due to care responsibilities by sex (%) | Annual | |
| Share of persons outside the labour force due to care responsibilities by sex and age (%) | Annual | |
| Share of persons outside the labour force due to care responsibilities by sex and education (%) | Annual | |
| Share of persons outside the labour force due to care responsibilities by sex and rural / urban areas (%) | Annual | |
| Youth not in employment, education or training (NEET) by sex and marital status (thousands) | Annual | |
| Share of youth not in employment, education or training (NEET) by sex and marital status (%) | Annual | |
|
▸
Disability Labour Market Indicators (DLMI)
38 tables
|
||
| Unemployment by sex, age and disability status (thousands) | Annual | |
| Unemployment by sex, education and disability status (thousands) | Annual | |
| Unemployment by sex, rural / urban areas and disability status (thousands) | Annual | |
| Unemployment by sex, rural / urban areas and disability status (thousands) | Quarterly | |
| Unemployment by sex and disability status (thousands) | Annual | |
| Unemployment by sex, marital status and disability status (thousands) | Annual | |
| Unemployment by sex, marital status and disability status (thousands) | Quarterly | |
| Unemployment rate by sex, age and disability status (%) | Annual | |
| Unemployment rate by sex, education and disability status (%) | Annual | |
| Unemployment rate by sex, rural / urban areas and disability status (%) | Annual | |
| Unemployment rate by sex, rural / urban areas and disability status (%) | Quarterly | |
| Unemployment rate by sex and disability status (%) | Annual | |
| Unemployment rate by sex, marital status and disability status (%) | Annual | |
| Unemployment rate by sex, marital status and disability status (%) | Quarterly | |
| Unemployment rate by sex and age, seasonally adjusted series (%) | Quarterly | |
| Unemployment rate by sex and age, seasonally adjusted series (%) | Monthly | |
| Combined rate of time-related underemployment and unemployment (LU2) by sex and disability status (%) | Annual | |
| Combined rate of unemployment and potential labour force (LU3) by sex and disability status (%) | Annual | |
| Composite rate of labour underutilization (LU4) by sex and disability status (%) | Annual | |
| Discouraged job-seekers by sex and disability status (thousands) | Annual | |
| Potential labour force by sex and disability status (thousands) | Annual | |
| Persons outside the labour force by sex, age and disability status (thousands) | Annual | |
| Persons outside the labour force by sex, education and disability status (thousands) | Annual | |
| Persons outside the labour force by sex, rural / urban areas and disability status (thousands) | Annual | |
| Persons outside the labour force by sex, rural / urban areas and disability status (thousands) | Quarterly | |
| Persons outside the labour force by sex, marital status and disability status (thousands) | Annual | |
| Persons outside the labour force by sex, marital status and disability status (thousands) | Quarterly | |
| Persons outside the labour force by sex and disability status (thousands) | Annual | |
| Persons outside the labour force by sex and disability status (thousands) | Quarterly | |
| Inactivity rate by sex, age and disability status (%) | Annual | |
| Inactivity rate by sex, education and disability status (%) | Annual | |
| Inactivity rate by sex, rural / urban areas and disability status (%) | Annual | |
| Inactivity rate by sex, rural / urban areas and disability status (%) | Quarterly | |
| Inactivity rate by sex, marital status and disability status (%) | Annual | |
| Inactivity rate by sex, marital status and disability status (%) | Quarterly | |
| Inactivity rate by sex and disability status (%) | Annual | |
| Youth not in employment, education or training (NEET) by sex and disability status (thousands) | Annual | |
| Share of youth not in employment, education or training (NEET) by sex and disability status (%) | Annual | |
|
▸
Rural and Urban Labour Markets (RURBAN)
65 tables
|
||
| Unemployment by sex, age and rural / urban areas (thousands) | Annual | |
| Unemployment by sex, age and rural / urban areas (thousands) | Quarterly | |
| Unemployment by sex, age and rural / urban areas (thousands) | Monthly | |
| Unemployment by sex and rural / urban areas (thousands) | Annual | |
| Unemployment by sex and rural / urban areas (thousands) | Quarterly | |
| Unemployment by sex and rural / urban areas (thousands) | Monthly | |
| Unemployment by sex, rural / urban area and marital status (thousands) | Annual | |
| Unemployment by sex, rural / urban area and marital status (thousands) | Quarterly | |
| Unemployment by sex, duration and rural / urban areas (thousands) | Annual | |
| Unemployment rate by sex, age and rural / urban areas (%) | Annual | |
| Unemployment rate by sex, age and rural / urban areas (%) | Quarterly | |
| Unemployment rate by sex, age and rural / urban areas (%) | Monthly | |
| Unemployment rate by sex and rural / urban areas (%) | Annual | |
| Unemployment rate by sex and rural / urban areas (%) | Quarterly | |
| Unemployment rate by sex and rural / urban areas (%) | Monthly | |
| Unemployment rate by sex, rural / urban area and marital status (%) | Annual | |
| Unemployment rate by sex, rural / urban area and marital status (%) | Quarterly | |
| Combined rate of time-related underemployment and unemployment (LU2) by sex, age and rural / urban areas (%) | Annual | |
| Combined rate of time-related underemployment and unemployment (LU2) by sex, age and rural / urban areas (%) | Quarterly | |
| Combined rate of time-related underemployment and unemployment (LU2) by sex and rural / urban areas (%) | Annual | |
| Combined rate of time-related underemployment and unemployment (LU2) by sex and rural / urban areas (%) | Quarterly | |
| Combined rate of time-related underemployment and unemployment (LU2) by sex, rural / urban area and marital status (%) | Annual | |
| Combined rate of time-related underemployment and unemployment (LU2) by sex, rural / urban area and marital status (%) | Quarterly | |
| Combined rate of unemployment and potential labour force (LU3) by sex, age and rural / urban areas (%) | Annual | |
| Combined rate of unemployment and potential labour force (LU3) by sex, age and rural / urban areas (%) | Quarterly | |
| Combined rate of unemployment and potential labour force (LU3) by sex and rural / urban areas (%) | Annual | |
| Combined rate of unemployment and potential labour force (LU3) by sex and rural / urban areas (%) | Quarterly | |
| Combined rate of unemployment and potential labour force (LU3) by sex, rural / urban area and marital status (%) | Annual | |
| Combined rate of unemployment and potential labour force (LU3) by sex, rural / urban area and marital status (%) | Quarterly | |
| Composite rate of labour underutilization (LU4) by sex, age and rural / urban areas (%) | Annual | |
| Composite rate of labour underutilization (LU4) by sex, age and rural / urban areas (%) | Quarterly | |
| Composite rate of labour underutilization (LU4) by sex and rural / urban areas (%) | Annual | |
| Composite rate of labour underutilization (LU4) by sex and rural / urban areas (%) | Quarterly | |
| Composite rate of labour underutilization (LU4) by sex, rural / urban area and marital status (%) | Annual | |
| Composite rate of labour underutilization (LU4) by sex, rural / urban area and marital status (%) | Quarterly | |
| Discouraged job-seekers by sex, age and rural / urban areas (thousands) | Annual | |
| Discouraged job-seekers by sex, age and rural / urban areas (thousands) | Quarterly | |
| Discouraged job-seekers by sex and rural / urban areas (thousands) | Annual | |
| Discouraged job-seekers by sex and rural / urban areas (thousands) | Quarterly | |
| Discouraged job-seekers by sex, rural / urban area and marital status (thousands) | Annual | |
| Discouraged job-seekers by sex, rural / urban area and marital status (thousands) | Quarterly | |
| Potential labour force by sex, age and rural / urban areas (thousands) | Annual | |
| Potential labour force by sex, age and rural / urban areas (thousands) | Quarterly | |
| Potential labour force by sex and rural / urban areas (thousands) | Annual | |
| Potential labour force by sex and rural / urban areas (thousands) | Quarterly | |
| Potential labour force by sex, rural / urban area and marital status (thousands) | Annual | |
| Potential labour force by sex, rural / urban area and marital status (thousands) | Quarterly | |
| Persons outside the labour force by sex, age and rural / urban areas (thousands) | Annual | |
| Persons outside the labour force by sex, age and rural / urban areas (thousands) | Quarterly | |
| Persons outside the labour force by sex, age and rural / urban areas (thousands) | Monthly | |
| Persons outside the labour force by sex and rural / urban areas (thousands) | Annual | |
| Persons outside the labour force by sex and rural / urban areas (thousands) | Quarterly | |
| Persons outside the labour force by sex and rural / urban areas (thousands) | Monthly | |
| Persons outside the labour force by sex, rural / urban area and marital status (thousands) | Annual | |
| Persons outside the labour force by sex, rural / urban area and marital status (thousands) | Quarterly | |
| Inactivity rate by sex, age and rural / urban areas (%) | Annual | |
| Inactivity rate by sex, age and rural / urban areas (%) | Quarterly | |
| Inactivity rate by sex, age and rural / urban areas (%) | Monthly | |
| Inactivity rate by sex and rural / urban areas (%) | Annual | |
| Inactivity rate by sex and rural / urban areas (%) | Quarterly | |
| Inactivity rate by sex and rural / urban areas (%) | Monthly | |
| Inactivity rate by sex, rural / urban area and marital status (%) | Annual | |
| Inactivity rate by sex, rural / urban area and marital status (%) | Quarterly | |
| Youth not in employment, education or training (NEET) by sex and rural / urban areas (thousands) | Annual | |
| Share of youth not in employment, education or training (NEET) by sex and rural / urban areas (%) | Annual | |
|
▸
Education and Mismatch Indicators (EMI)
81 tables
|
||
| Unemployment by sex, age and education (thousands) | Annual | |
| Unemployment by sex, age and education (thousands) | Quarterly | |
| Unemployment by sex, age and education (thousands) | Monthly | |
| Unemployment by sex and education (thousands) | Annual | |
| Unemployment by sex and education (thousands) | Quarterly | |
| Unemployment by sex and education (thousands) | Monthly | |
| Unemployment by sex, education and rural / urban areas (thousands) | Annual | |
| Unemployment by sex, education and rural / urban areas (thousands) | Quarterly | |
| Unemployment by sex, education and marital status (thousands) | Annual | |
| Unemployment of previously employed persons by sex, former economic activity and education (thousands) | Annual | |
| Unemployment by sex, occupation and education (thousands) | Annual | |
| Unemployment rate by sex, age and education (%) | Annual | |
| Unemployment rate by sex, age and education (%) | Quarterly | |
| Unemployment rate by sex, age and education (%) | Monthly | |
| Unemployment rate by sex and education (%) | Annual | |
| Unemployment rate by sex and education (%) | Quarterly | |
| Unemployment rate by sex and education (%) | Monthly | |
| Unemployment rate by sex, education and rural / urban areas (%) | Annual | |
| Unemployment rate by sex, education and rural / urban areas (%) | Quarterly | |
| Unemployment rate by sex, education and marital status (%) | Annual | |
| Combined rate of time-related underemployment and unemployment (LU2) by sex, age and education (%) | Annual | |
| Combined rate of time-related underemployment and unemployment (LU2) by sex, age and education (%) | Quarterly | |
| Combined rate of time-related underemployment and unemployment (LU2) by sex and education (%) | Annual | |
| Combined rate of time-related underemployment and unemployment (LU2) by sex and education (%) | Quarterly | |
| Combined rate of time-related underemployment and unemployment (LU2) by sex, education and rural / urban areas (%) | Annual | |
| Combined rate of time-related underemployment and unemployment (LU2) by sex, education and rural / urban areas (%) | Quarterly | |
| Combined rate of time-related underemployment and unemployment (LU2) by sex, education and marital status (%) | Annual | |
| Combined rate of time-related underemployment and unemployment (LU2) by sex, education and marital status (%) | Quarterly | |
| Combined rate of unemployment and potential labour force (LU3) by sex, age and education (%) | Annual | |
| Combined rate of unemployment and potential labour force (LU3) by sex, age and education (%) | Quarterly | |
| Combined rate of unemployment and potential labour force (LU3) by sex and education (%) | Annual | |
| Combined rate of unemployment and potential labour force (LU3) by sex and education (%) | Quarterly | |
| Combined rate of unemployment and potential labour force (LU3) by sex, education and rural / urban areas (%) | Annual | |
| Combined rate of unemployment and potential labour force (LU3) by sex, education and rural / urban areas (%) | Quarterly | |
| Combined rate of unemployment and potential labour force (LU3) by sex, education and marital status (%) | Annual | |
| Combined rate of unemployment and potential labour force (LU3) by sex, education and marital status (%) | Quarterly | |
| Composite rate of labour underutilization (LU4) by sex, age and education (%) | Annual | |
| Composite rate of labour underutilization (LU4) by sex, age and education (%) | Quarterly | |
| Composite rate of labour underutilization (LU4) by sex and education (%) | Annual | |
| Composite rate of labour underutilization (LU4) by sex and education (%) | Quarterly | |
| Composite rate of labour underutilization (LU4) by sex, education and rural / urban areas (%) | Annual | |
| Composite rate of labour underutilization (LU4) by sex, education and rural / urban areas (%) | Quarterly | |
| Composite rate of labour underutilization (LU4) by sex, education and marital status (%) | Annual | |
| Composite rate of labour underutilization (LU4) by sex, education and marital status (%) | Quarterly | |
| Discouraged job-seekers by sex, age and education (thousands) | Annual | |
| Discouraged job-seekers by sex, age and education (thousands) | Quarterly | |
| Discouraged job-seekers by sex and education (thousands) | Annual | |
| Discouraged job-seekers by sex and education (thousands) | Quarterly | |
| Discouraged job-seekers by sex, education and rural / urban areas (thousands) | Annual | |
| Discouraged job-seekers by sex, education and rural / urban areas (thousands) | Quarterly | |
| Discouraged job-seekers by sex, education and marital status (thousands) | Annual | |
| Discouraged job-seekers by sex, education and marital status (thousands) | Quarterly | |
| Potential labour force by sex, age and education (thousands) | Annual | |
| Potential labour force by sex, age and education (thousands) | Quarterly | |
| Potential labour force by sex and education (thousands) | Annual | |
| Potential labour force by sex and education (thousands) | Quarterly | |
| Potential labour force by sex, education and rural / urban areas (thousands) | Annual | |
| Potential labour force by sex, education and rural / urban areas (thousands) | Quarterly | |
| Potential labour force by sex, education and marital status (thousands) | Annual | |
| Potential labour force by sex, education and marital status (thousands) | Quarterly | |
| Persons outside the labour force by sex, age and education (thousands) | Annual | |
| Persons outside the labour force by sex, age and education (thousands) | Quarterly | |
| Persons outside the labour force by sex, age and education (thousands) | Monthly | |
| Persons outside the labour force by sex and education (thousands) | Annual | |
| Persons outside the labour force by sex and education (thousands) | Quarterly | |
| Persons outside the labour force by sex and education (thousands) | Monthly | |
| Persons outside the labour force by sex, education and rural / urban areas (thousands) | Annual | |
| Persons outside the labour force by sex, education and rural / urban areas (thousands) | Quarterly | |
| Persons outside the labour force by sex, education and marital status (thousands) | Annual | |
| Persons outside the labour force by sex, education and marital status (thousands) | Quarterly | |
| Inactivity rate by sex, age and education (%) | Annual | |
| Inactivity rate by sex, age and education (%) | Quarterly | |
| Inactivity rate by sex, age and education (%) | Monthly | |
| Inactivity rate by sex and education (%) | Annual | |
| Inactivity rate by sex and education (%) | Quarterly | |
| Inactivity rate by sex and education (%) | Monthly | |
| Inactivity rate by sex, education and rural / urban areas (%) | Annual | |
| Inactivity rate by sex, education and rural / urban areas (%) | Quarterly | |
| Inactivity rate by sex, education and marital status (%) | Annual | |
| Youth not in employment, education or training (NEET) by sex and education (thousands) | Annual | |
| Share of youth not in employment, education or training (NEET) by sex and education (%) | Annual | |
|
▸
Unemployment rate (SDG 8.5.2)
4 tables
|
||
| SDG indicator 8.5.2 - Unemployment rate by sex and age (%) | Annual | |
| SDG indicator 8.5.2 - Unemployment rate by sex and age -- 19th ICLS (%) | Annual | |
| SDG indicator 8.5.2 - Unemployment rate by sex and disability status (%) | Annual | |
| SDG indicator 8.5.2 - Unemployment rate by sex and disability status -- 19th ICLS (%) | Annual | |
|
▸
Youth NEET rate (SDG 8.6.1)
1 table
|
||
| SDG indicator 8.6.1 - Proportion of youth (aged 15-24 years) not in education, employment or training by sex (%) | Annual | |
|
▸
Unemployment (previous ILO definition)
43 tables
|
||
| Unemployment by sex and age (thousands) | Annual | |
| Unemployment by sex and age (thousands) | Quarterly | |
| Unemployment by sex and age (thousands) | Monthly | |
| Unemployment by sex, age and education (thousands) | Annual | |
| Unemployment by sex, age and education (thousands) | Quarterly | |
| Unemployment by sex, age and education (thousands) | Monthly | |
| Unemployment by sex, age and rural / urban areas (thousands) | Annual | |
| Unemployment by sex, age and rural / urban areas (thousands) | Quarterly | |
| Unemployment by sex, age and rural / urban areas (thousands) | Monthly | |
| Unemployment by sex, age and marital status (thousands) | Annual | |
| Unemployment by sex, age and marital status (thousands) | Quarterly | |
| Unemployment by sex, age and disability status (thousands) | Annual | |
| Unemployment by sex and education (thousands) | Annual | |
| Unemployment by sex and education (thousands) | Quarterly | |
| Unemployment by sex and education (thousands) | Monthly | |
| Unemployment by sex, education and rural / urban areas (thousands) | Annual | |
| Unemployment by sex, education and rural / urban areas (thousands) | Quarterly | |
| Unemployment by sex, education and marital status (thousands) | Annual | |
| Unemployment by sex, education and disability status (thousands) | Annual | |
| Unemployment by sex and rural / urban areas (thousands) | Annual | |
| Unemployment by sex and rural / urban areas (thousands) | Quarterly | |
| Unemployment by sex and rural / urban areas (thousands) | Monthly | |
| Unemployment by sex, rural / urban area and marital status (thousands) | Annual | |
| Unemployment by sex, rural / urban area and marital status (thousands) | Quarterly | |
| Unemployment by sex and marital status (thousands) | Annual | |
| Unemployment by sex and marital status (thousands) | Quarterly | |
| Unemployment by sex and marital status (thousands) | Monthly | |
| Unemployment by sex, rural / urban areas and disability status (thousands) | Annual | |
| Unemployment by sex, rural / urban areas and disability status (thousands) | Quarterly | |
| Unemployment by sex and disability status (thousands) | Annual | |
| Unemployment by sex, marital status and disability status (thousands) | Annual | |
| Unemployment by sex, marital status and disability status (thousands) | Quarterly | |
| Unemployment by sex, age and duration (thousands) | Annual | |
| Unemployment by sex, age and duration (thousands) | Quarterly | |
| Unemployment by sex, age and duration (thousands) | Monthly | |
| Unemployment by sex, duration and rural / urban areas (thousands) | Annual | |
| Unemployment by sex, duration and marital status (thousands) | Annual | |
| Unemployment of previously employed persons by sex and former economic activity (thousands) | Annual | |
| Unemployment of previously employed persons by sex, former economic activity and education (thousands) | Annual | |
| Unemployment of previously employed persons by sex and former occupation (thousands) | Annual | |
| Unemployment by sex, occupation and education (thousands) | Annual | |
| Unemployment by sex and categories of unemployed persons (thousands) | Annual | |
| Unemployment by sex and categories of unemployed persons (thousands) | Quarterly | |
|
▸
Unemployment, SA (previous ILO definition)
3 tables
|
||
| Unemployment by sex and age, seasonally adjusted series (thousands) | Quarterly | |
| Unemployment by sex and age, seasonally adjusted series (thousands) | Monthly | |
| Unemployment by sex, age and duration, seasonally adjusted series (thousands) | Quarterly | |
|
▸
Unemployment rate (previous ILO definition)
32 tables
|
||
| Unemployment rate by sex and age (%) | Annual | |
| Unemployment rate by sex and age (%) | Quarterly | |
| Unemployment rate by sex and age (%) | Monthly | |
| Unemployment rate by sex, age and education (%) | Annual | |
| Unemployment rate by sex, age and education (%) | Quarterly | |
| Unemployment rate by sex, age and education (%) | Monthly | |
| Unemployment rate by sex, age and rural / urban areas (%) | Annual | |
| Unemployment rate by sex, age and rural / urban areas (%) | Quarterly | |
| Unemployment rate by sex, age and rural / urban areas (%) | Monthly | |
| Unemployment rate by sex, age and marital status (%) | Annual | |
| Unemployment rate by sex, age and marital status (%) | Quarterly | |
| Unemployment rate by sex, age and disability status (%) | Annual | |
| Unemployment rate by sex and education (%) | Annual | |
| Unemployment rate by sex and education (%) | Quarterly | |
| Unemployment rate by sex and education (%) | Monthly | |
| Unemployment rate by sex, education and rural / urban areas (%) | Annual | |
| Unemployment rate by sex, education and rural / urban areas (%) | Quarterly | |
| Unemployment rate by sex, education and marital status (%) | Annual | |
| Unemployment rate by sex, education and disability status (%) | Annual | |
| Unemployment rate by sex and rural / urban areas (%) | Annual | |
| Unemployment rate by sex and rural / urban areas (%) | Quarterly | |
| Unemployment rate by sex and rural / urban areas (%) | Monthly | |
| Unemployment rate by sex, rural / urban area and marital status (%) | Annual | |
| Unemployment rate by sex, rural / urban area and marital status (%) | Quarterly | |
| Unemployment rate by sex, rural / urban areas and disability status (%) | Annual | |
| Unemployment rate by sex, rural / urban areas and disability status (%) | Quarterly | |
| Unemployment rate by sex and marital status (%) | Annual | |
| Unemployment rate by sex and marital status (%) | Quarterly | |
| Unemployment rate by sex and marital status (%) | Monthly | |
| Unemployment rate by sex and disability status (%) | Annual | |
| Unemployment rate by sex, marital status and disability status (%) | Annual | |
| Unemployment rate by sex, marital status and disability status (%) | Quarterly | |
|
▸
Unemployment rate, SA (previous ILO definition)
2 tables
|
||
| Unemployment rate by sex and age, seasonally adjusted series (%) | Quarterly | |
| Unemployment rate by sex and age, seasonally adjusted series (%) | Monthly | |
|
▸
Prime-age unemployment rate (previous ILO definition)
2 tables
|
||
| Prime-age unemployment rate by sex, household type and presence of children (%) | Annual | |
| Prime-age unemployment rate by sex, household type and rural / urban areas (%) | Annual | |
|
▸
LU2: Combined rate of time-related underemployment and unemployment (previous ILO definition)
22 tables
|
||
| Combined rate of time-related underemployment and unemployment (LU2) by sex and age (%) | Annual | |
| Combined rate of time-related underemployment and unemployment (LU2) by sex and age (%) | Quarterly | |
| Combined rate of time-related underemployment and unemployment (LU2) by sex and age (%) | Monthly | |
| Combined rate of time-related underemployment and unemployment (LU2) by sex, age and education (%) | Annual | |
| Combined rate of time-related underemployment and unemployment (LU2) by sex, age and education (%) | Quarterly | |
| Combined rate of time-related underemployment and unemployment (LU2) by sex, age and rural / urban areas (%) | Annual | |
| Combined rate of time-related underemployment and unemployment (LU2) by sex, age and rural / urban areas (%) | Quarterly | |
| Combined rate of time-related underemployment and unemployment (LU2) by sex, age and marital status (%) | Annual | |
| Combined rate of time-related underemployment and unemployment (LU2) by sex, age and marital status (%) | Quarterly | |
| Combined rate of time-related underemployment and unemployment (LU2) by sex and education (%) | Annual | |
| Combined rate of time-related underemployment and unemployment (LU2) by sex and education (%) | Quarterly | |
| Combined rate of time-related underemployment and unemployment (LU2) by sex, education and rural / urban areas (%) | Annual | |
| Combined rate of time-related underemployment and unemployment (LU2) by sex, education and rural / urban areas (%) | Quarterly | |
| Combined rate of time-related underemployment and unemployment (LU2) by sex, education and marital status (%) | Annual | |
| Combined rate of time-related underemployment and unemployment (LU2) by sex, education and marital status (%) | Quarterly | |
| Combined rate of time-related underemployment and unemployment (LU2) by sex and rural / urban areas (%) | Annual | |
| Combined rate of time-related underemployment and unemployment (LU2) by sex and rural / urban areas (%) | Quarterly | |
| Combined rate of time-related underemployment and unemployment (LU2) by sex, rural / urban area and marital status (%) | Annual | |
| Combined rate of time-related underemployment and unemployment (LU2) by sex, rural / urban area and marital status (%) | Quarterly | |
| Combined rate of time-related underemployment and unemployment (LU2) by sex and marital status (%) | Annual | |
| Combined rate of time-related underemployment and unemployment (LU2) by sex and marital status (%) | Quarterly | |
| Combined rate of time-related underemployment and unemployment (LU2) by sex and disability status (%) | Annual | |
|
▸
LU2: Combined rate of time-related underemployment and unemployment for persons ages 25 to 54 (previous ILO definition)
2 tables
|
||
| Prime-age combined rate of time-related underemployment and unemployment (LU2) by sex, household type and presence of children (%) | Annual | |
| Prime-age combined rate of time-related underemployment and unemployment (LU2) by sex, household type and rural / urban areas (%) | Annual | |
|
▸
LU3: Combined rate of unemployment and potential labour force (previous ILO definition)
22 tables
|
||
| Combined rate of unemployment and potential labour force (LU3) by sex and age (%) | Annual | |
| Combined rate of unemployment and potential labour force (LU3) by sex and age (%) | Quarterly | |
| Combined rate of unemployment and potential labour force (LU3) by sex and age (%) | Monthly | |
| Combined rate of unemployment and potential labour force (LU3) by sex, age and education (%) | Annual | |
| Combined rate of unemployment and potential labour force (LU3) by sex, age and education (%) | Quarterly | |
| Combined rate of unemployment and potential labour force (LU3) by sex, age and rural / urban areas (%) | Annual | |
| Combined rate of unemployment and potential labour force (LU3) by sex, age and rural / urban areas (%) | Quarterly | |
| Combined rate of unemployment and potential labour force (LU3) by sex, age and marital status (%) | Annual | |
| Combined rate of unemployment and potential labour force (LU3) by sex, age and marital status (%) | Quarterly | |
| Combined rate of unemployment and potential labour force (LU3) by sex and education (%) | Annual | |
| Combined rate of unemployment and potential labour force (LU3) by sex and education (%) | Quarterly | |
| Combined rate of unemployment and potential labour force (LU3) by sex, education and rural / urban areas (%) | Annual | |
| Combined rate of unemployment and potential labour force (LU3) by sex, education and rural / urban areas (%) | Quarterly | |
| Combined rate of unemployment and potential labour force (LU3) by sex, education and marital status (%) | Annual | |
| Combined rate of unemployment and potential labour force (LU3) by sex, education and marital status (%) | Quarterly | |
| Combined rate of unemployment and potential labour force (LU3) by sex and rural / urban areas (%) | Annual | |
| Combined rate of unemployment and potential labour force (LU3) by sex and rural / urban areas (%) | Quarterly | |
| Combined rate of unemployment and potential labour force (LU3) by sex, rural / urban area and marital status (%) | Annual | |
| Combined rate of unemployment and potential labour force (LU3) by sex, rural / urban area and marital status (%) | Quarterly | |
| Combined rate of unemployment and potential labour force (LU3) by sex and marital status (%) | Annual | |
| Combined rate of unemployment and potential labour force (LU3) by sex and marital status (%) | Quarterly | |
| Combined rate of unemployment and potential labour force (LU3) by sex and disability status (%) | Annual | |
|
▸
LU3: Combined rate of unemployment and potential labour force for persons ages 25 to 54 (previous ILO definition)
2 tables
|
||
| Prime-age combined rate of unemployment and potential labour force (LU3) by sex, household type and presence of children (%) | Annual | |
| Prime-age combined rate of unemployment and potential labour force (LU3) by sex, household type and rural / urban areas (%) | Annual | |
|
▸
LU4: Composite rate of labour underutilization (previous ILO definition)
22 tables
|
||
| Composite rate of labour underutilization (LU4) by sex and age (%) | Annual | |
| Composite rate of labour underutilization (LU4) by sex and age (%) | Quarterly | |
| Composite rate of labour underutilization (LU4) by sex and age (%) | Monthly | |
| Composite rate of labour underutilization (LU4) by sex, age and education (%) | Annual | |
| Composite rate of labour underutilization (LU4) by sex, age and education (%) | Quarterly | |
| Composite rate of labour underutilization (LU4) by sex, age and rural / urban areas (%) | Annual | |
| Composite rate of labour underutilization (LU4) by sex, age and rural / urban areas (%) | Quarterly | |
| Composite rate of labour underutilization (LU4) by sex, age and marital status (%) | Annual | |
| Composite rate of labour underutilization (LU4) by sex, age and marital status (%) | Quarterly | |
| Composite rate of labour underutilization (LU4) by sex and education (%) | Annual | |
| Composite rate of labour underutilization (LU4) by sex and education (%) | Quarterly | |
| Composite rate of labour underutilization (LU4) by sex, education and rural / urban areas (%) | Annual | |
| Composite rate of labour underutilization (LU4) by sex, education and rural / urban areas (%) | Quarterly | |
| Composite rate of labour underutilization (LU4) by sex, education and marital status (%) | Annual | |
| Composite rate of labour underutilization (LU4) by sex, education and marital status (%) | Quarterly | |
| Composite rate of labour underutilization (LU4) by sex and rural / urban areas (%) | Annual | |
| Composite rate of labour underutilization (LU4) by sex and rural / urban areas (%) | Quarterly | |
| Composite rate of labour underutilization (LU4) by sex, rural / urban area and marital status (%) | Annual | |
| Composite rate of labour underutilization (LU4) by sex, rural / urban area and marital status (%) | Quarterly | |
| Composite rate of labour underutilization (LU4) by sex and marital status (%) | Annual | |
| Composite rate of labour underutilization (LU4) by sex and marital status (%) | Quarterly | |
| Composite rate of labour underutilization (LU4) by sex and disability status (%) | Annual | |
|
▸
LU4: Composite rate of labour underutilization for persons ages 25 to 54 (previous ILO definition)
2 tables
|
||
| Prime-age composite rate of labour underutilization (LU4) by sex, household type and presence of children (%) | Annual | |
| Prime-age composite rate of labour underutilization (LU4) by sex, household type and rural / urban areas (%) | Annual | |
|
▸
Jobs gap
1 table
|
||
| Jobs gap (thousands) | Annual | |
|
▸
Jobs gap rate
1 table
|
||
| Jobs gap rate (%) | Annual | |
|
▸
Discouraged jobseekers (previous ILO definition)
22 tables
|
||
| Discouraged job-seekers by sex and age (thousands) | Annual | |
| Discouraged job-seekers by sex and age (thousands) | Quarterly | |
| Discouraged job-seekers by sex and age (thousands) | Monthly | |
| Discouraged job-seekers by sex, age and education (thousands) | Annual | |
| Discouraged job-seekers by sex, age and education (thousands) | Quarterly | |
| Discouraged job-seekers by sex, age and rural / urban areas (thousands) | Annual | |
| Discouraged job-seekers by sex, age and rural / urban areas (thousands) | Quarterly | |
| Discouraged job-seekers by sex, age and marital status (thousands) | Annual | |
| Discouraged job-seekers by sex, age and marital status (thousands) | Quarterly | |
| Discouraged job-seekers by sex and education (thousands) | Annual | |
| Discouraged job-seekers by sex and education (thousands) | Quarterly | |
| Discouraged job-seekers by sex, education and rural / urban areas (thousands) | Annual | |
| Discouraged job-seekers by sex, education and rural / urban areas (thousands) | Quarterly | |
| Discouraged job-seekers by sex, education and marital status (thousands) | Annual | |
| Discouraged job-seekers by sex, education and marital status (thousands) | Quarterly | |
| Discouraged job-seekers by sex and rural / urban areas (thousands) | Annual | |
| Discouraged job-seekers by sex and rural / urban areas (thousands) | Quarterly | |
| Discouraged job-seekers by sex, rural / urban area and marital status (thousands) | Annual | |
| Discouraged job-seekers by sex, rural / urban area and marital status (thousands) | Quarterly | |
| Discouraged job-seekers by sex and marital status (thousands) | Annual | |
| Discouraged job-seekers by sex and marital status (thousands) | Quarterly | |
| Discouraged job-seekers by sex and disability status (thousands) | Annual | |
|
▸
Potential labour force (previous ILO definition)
22 tables
|
||
| Potential labour force by sex and age (thousands) | Annual | |
| Potential labour force by sex and age (thousands) | Quarterly | |
| Potential labour force by sex and age (thousands) | Monthly | |
| Potential labour force by sex, age and education (thousands) | Annual | |
| Potential labour force by sex, age and education (thousands) | Quarterly | |
| Potential labour force by sex, age and rural / urban areas (thousands) | Annual | |
| Potential labour force by sex, age and rural / urban areas (thousands) | Quarterly | |
| Potential labour force by sex, age and marital status (thousands) | Annual | |
| Potential labour force by sex, age and marital status (thousands) | Quarterly | |
| Potential labour force by sex and education (thousands) | Annual | |
| Potential labour force by sex and education (thousands) | Quarterly | |
| Potential labour force by sex, education and rural / urban areas (thousands) | Annual | |
| Potential labour force by sex, education and rural / urban areas (thousands) | Quarterly | |
| Potential labour force by sex, education and marital status (thousands) | Annual | |
| Potential labour force by sex, education and marital status (thousands) | Quarterly | |
| Potential labour force by sex and rural / urban areas (thousands) | Annual | |
| Potential labour force by sex and rural / urban areas (thousands) | Quarterly | |
| Potential labour force by sex, rural / urban area and marital status (thousands) | Annual | |
| Potential labour force by sex, rural / urban area and marital status (thousands) | Quarterly | |
| Potential labour force by sex and marital status (thousands) | Annual | |
| Potential labour force by sex and marital status (thousands) | Quarterly | |
| Potential labour force by sex and disability status (thousands) | Annual | |
|
▸
Potential labour force and willing non-jobseekers (previous ILO definition)
1 table
|
||
| Potential labour force and willing non-jobseekers (thousands) | Annual | |
|
▸
Persons outside the labour force (previous ILO definition)
34 tables
|
||
| Persons outside the labour force by sex and age (thousands) | Annual | |
| Persons outside the labour force by sex and age (thousands) | Quarterly | |
| Persons outside the labour force by sex and age (thousands) | Monthly | |
| Persons outside the labour force by sex, age and education (thousands) | Annual | |
| Persons outside the labour force by sex, age and education (thousands) | Quarterly | |
| Persons outside the labour force by sex, age and education (thousands) | Monthly | |
| Persons outside the labour force by sex, age and rural / urban areas (thousands) | Annual | |
| Persons outside the labour force by sex, age and rural / urban areas (thousands) | Quarterly | |
| Persons outside the labour force by sex, age and rural / urban areas (thousands) | Monthly | |
| Persons outside the labour force by sex, age and marital status (thousands) | Annual | |
| Persons outside the labour force by sex, age and marital status (thousands) | Quarterly | |
| Persons outside the labour force by sex, age and disability status (thousands) | Annual | |
| Persons outside the labour force by sex and education (thousands) | Annual | |
| Persons outside the labour force by sex and education (thousands) | Quarterly | |
| Persons outside the labour force by sex and education (thousands) | Monthly | |
| Persons outside the labour force by sex, education and rural / urban areas (thousands) | Annual | |
| Persons outside the labour force by sex, education and rural / urban areas (thousands) | Quarterly | |
| Persons outside the labour force by sex, education and marital status (thousands) | Annual | |
| Persons outside the labour force by sex, education and marital status (thousands) | Quarterly | |
| Persons outside the labour force by sex, education and disability status (thousands) | Annual | |
| Persons outside the labour force by sex and rural / urban areas (thousands) | Annual | |
| Persons outside the labour force by sex and rural / urban areas (thousands) | Quarterly | |
| Persons outside the labour force by sex and rural / urban areas (thousands) | Monthly | |
| Persons outside the labour force by sex, rural / urban area and marital status (thousands) | Annual | |
| Persons outside the labour force by sex, rural / urban area and marital status (thousands) | Quarterly | |
| Persons outside the labour force by sex, rural / urban areas and disability status (thousands) | Annual | |
| Persons outside the labour force by sex, rural / urban areas and disability status (thousands) | Quarterly | |
| Persons outside the labour force by sex and marital status (thousands) | Annual | |
| Persons outside the labour force by sex and marital status (thousands) | Quarterly | |
| Persons outside the labour force by sex and marital status (thousands) | Monthly | |
| Persons outside the labour force by sex, marital status and disability status (thousands) | Annual | |
| Persons outside the labour force by sex, marital status and disability status (thousands) | Quarterly | |
| Persons outside the labour force by sex and disability status (thousands) | Annual | |
| Persons outside the labour force by sex and disability status (thousands) | Quarterly | |
|
▸
Potential labour force and willing non-jobseekers rate (previous ILO definition)
1 table
|
||
| Potential labour force and willing non-jobseekers rate (%) | Annual | |
|
▸
Inactivity rate (previous ILO definition)
32 tables
|
||
| Inactivity rate by sex and age (%) | Annual | |
| Inactivity rate by sex and age (%) | Quarterly | |
| Inactivity rate by sex and age (%) | Monthly | |
| Inactivity rate by sex, age and education (%) | Annual | |
| Inactivity rate by sex, age and education (%) | Quarterly | |
| Inactivity rate by sex, age and education (%) | Monthly | |
| Inactivity rate by sex, age and rural / urban areas (%) | Annual | |
| Inactivity rate by sex, age and rural / urban areas (%) | Quarterly | |
| Inactivity rate by sex, age and rural / urban areas (%) | Monthly | |
| Inactivity rate by sex, age and marital status (%) | Annual | |
| Inactivity rate by sex, age and marital status (%) | Quarterly | |
| Inactivity rate by sex, age and disability status (%) | Annual | |
| Inactivity rate by sex and education (%) | Annual | |
| Inactivity rate by sex and education (%) | Quarterly | |
| Inactivity rate by sex and education (%) | Monthly | |
| Inactivity rate by sex, education and rural / urban areas (%) | Annual | |
| Inactivity rate by sex, education and rural / urban areas (%) | Quarterly | |
| Inactivity rate by sex, education and marital status (%) | Annual | |
| Inactivity rate by sex, education and disability status (%) | Annual | |
| Inactivity rate by sex and rural / urban areas (%) | Annual | |
| Inactivity rate by sex and rural / urban areas (%) | Quarterly | |
| Inactivity rate by sex and rural / urban areas (%) | Monthly | |
| Inactivity rate by sex, rural / urban area and marital status (%) | Annual | |
| Inactivity rate by sex, rural / urban area and marital status (%) | Quarterly | |
| Inactivity rate by sex, rural / urban areas and disability status (%) | Annual | |
| Inactivity rate by sex, rural / urban areas and disability status (%) | Quarterly | |
| Inactivity rate by sex and marital status (%) | Annual | |
| Inactivity rate by sex and marital status (%) | Quarterly | |
| Inactivity rate by sex and marital status (%) | Monthly | |
| Inactivity rate by sex, marital status and disability status (%) | Annual | |
| Inactivity rate by sex, marital status and disability status (%) | Quarterly | |
| Inactivity rate by sex and disability status (%) | Annual | |
|
▸
Share of persons outside the labour force due to care responsibilities
4 tables
|
||
| Share of persons outside the labour force due to care responsibilities by sex (%) | Annual | |
| Share of persons outside the labour force due to care responsibilities by sex and age (%) | Annual | |
| Share of persons outside the labour force due to care responsibilities by sex and education (%) | Annual | |
| Share of persons outside the labour force due to care responsibilities by sex and rural / urban areas (%) | Annual | |
|
▸
Youth not in employment, education or training (previous ILO definition)
7 tables
|
||
| Youth not in employment, education or training (NEET) by sex (thousands) | Annual | |
| Youth not in employment, education or training (NEET) by sex (thousands) | Quarterly | |
| Youth not in employment, education or training (NEET) by sex and age (thousands) | Annual | |
| Youth not in employment, education or training (NEET) by sex and rural / urban areas (thousands) | Annual | |
| Youth not in employment, education or training (NEET) by sex and education (thousands) | Annual | |
| Youth not in employment, education or training (NEET) by sex and marital status (thousands) | Annual | |
| Youth not in employment, education or training (NEET) by sex and disability status (thousands) | Annual | |
|
▸
Share of youth not in employment, education or training (previous ILO definition)
7 tables
|
||
| Share of youth not in employment, education or training (NEET) by sex (%) | Annual | |
| Share of youth not in employment, education or training (NEET) by sex (%) | Quarterly | |
| Share of youth not in employment, education or training (NEET) by sex and age (%) | Annual | |
| Share of youth not in employment, education or training (NEET) by sex and rural / urban areas (%) | Annual | |
| Share of youth not in employment, education or training (NEET) by sex and education (%) | Annual | |
| Share of youth not in employment, education or training (NEET) by sex and marital status (%) | Annual | |
| Share of youth not in employment, education or training (NEET) by sex and disability status (%) | Annual | |
|
▸
Youth unemployment (previous ILO definition)
6 tables
|
||
| Youth unemployment by sex, age and education (thousands) | Annual | |
| Youth unemployment by sex, age and rural / urban areas (thousands) | Annual | |
| Youth unemployment by sex, age and school attendance status (thousands) | Annual | |
| Youth unemployment by sex, age and disability status (thousands) | Annual | |
| Youth unemployment by sex, age and categories of unemployed persons (thousands) | Annual | |
| Youth unemployment by sex, age and duration (thousands) | Annual | |
|
▸
Youth unemployment rate (previous ILO definition)
4 tables
|
||
| Youth unemployment rate by sex, age and disability status (%) | Annual | |
| Youth unemployment rate by sex, age and rural / urban areas (%) | Annual | |
| Youth unemployment rate by sex, age and education (%) | Annual | |
| Youth unemployment rate by sex, age and school attendance status (%) | Annual | |
|
▸
Youth unemployment-to-population ratio (previous ILO definition)
4 tables
|
||
| Youth unemployment-to-population ratio by sex, age and school attendance status (%) | Annual | |
| Youth unemployment-to-population ratio by sex, age and disability status (%) | Annual | |
| Youth unemployment-to-population ratio by sex, age and rural / urban areas (%) | Annual | |
| Youth unemployment-to-population ratio by sex, age and education (%) | Annual | |
|
▸
Youth outside the labour force (previous ILO definition)
4 tables
|
||
| Youth outside the labour force by sex, age and rural / urban areas (thousands) | Annual | |
| Youth outside the labour force by sex, age and education (thousands) | Annual | |
| Youth outside the labour force by sex, age and school attendance status (thousands) | Annual | |
| Youth outside the labour force by sex, age and disability status (thousands) | Annual | |
|
▸
Youth discouraged jobseekers (previous ILO definition)
1 table
|
||
| Youth discouraged job-seekers by sex, age and rural / urban areas (thousands) | Annual | |
|
▸
Youth inactivity rate (previous ILO definition)
4 tables
|
||
| Youth inactivity rate by sex, age and rural / urban areas (%) | Annual | |
| Youth inactivity rate by sex, age and education (%) | Annual | |
| Youth inactivity rate by sex, age and school attendance status (%) | Annual | |
| Youth inactivity rate by sex, age and disability status (%) | Annual | |
|
▸
Unemployment (ILO modelled estimates)
1 table
|
||
| Unemployment by sex and age -- ILO modelled estimates, Nov. 2025 (thousands) | Annual | |
|
▸
Unemployment rate (ILO modelled estimates)
1 table
|
||
| Unemployment rate by sex and age -- ILO modelled estimates, Nov. 2025 (%) | Annual | |
|
▸
LU2: Combined rate of time-related underemployment and unemployment (ILO modelled estimates)
1 table
|
||
| Combined rate of time-related underemployment and unemployment (LU2) by sex and age -- ILO modelled estimates, Nov. 2025 (%) | Annual | |
|
▸
LU3: Combined rate of unemployment and potential labour force (ILO modelled estimates)
1 table
|
||
| Combined rate of unemployment and potential labour force (LU3) by sex -- ILO modelled estimates, Nov. 2025 (%) | Annual | |
|
▸
LU4: Composite measure of labour underutilization (ILO modelled estimates)
1 table
|
||
| Composite measure of labour underutilization (LU4) by sex -- ILO modelled estimates, Nov. 2025 (thousands) | Annual | |
|
▸
LU4: Composite rate of labour underutilization (ILO modelled estimates)
1 table
|
||
| Composite rate of labour underutilization (LU4) by sex -- ILO modelled estimates, Nov. 2025 (%) | Annual | |
|
▸
Jobs gap (ILO modelled estimates)
1 table
|
||
| Jobs gap by sex -- ILO modelled estimates, Nov. 2025 (thousands) | Annual | |
|
▸
Jobs gap rate (ILO modelled estimates)
1 table
|
||
| Jobs gap rate by sex -- ILO modelled estimates, Nov. 2025 (%) | Annual | |
|
▸
Potential labour force (ILO modelled estimates)
1 table
|
||
| Potential labour force by sex -- ILO modelled estimates, Nov. 2025 (thousands) | Annual | |
|
▸
Potential labour force rate (ILO modelled estimates)
1 table
|
||
| Potential labour force rate by sex -- ILO modelled estimates, Nov. 2025 (%) | Annual | |
|
▸
Potential labour force and willing non-jobseekers (ILO modelled estimates)
1 table
|
||
| Potential labour force and willing non-jobseekers by sex -- ILO modelled estimates, Nov. 2025 (thousands) | Annual | |
|
▸
Potential labour force and willing non-jobseekers rate (ILO modelled estimates)
1 table
|
||
| Potential labour force and willing non-jobseekers rate -- ILO modelled estimates, Nov. 2025 (%) | Annual | |
|
▸
Persons outside the labour force (ILO modelled estimates)
1 table
|
||
| Persons outside the labour force by sex and age -- ILO modelled estimates, Nov. 2025 (thousands) | Annual | |
|
▸
Youth not in employment, education or training (ILO modelled estimates)
1 table
|
||
| Youth not in employment, education or training (NEET) by sex -- ILO modelled estimates, Nov. 2025 (thousands) | Annual | |
|
▸
Inactivity rate (ILO modelled estimates)
1 table
|
||
| Inactivity rate by sex and age -- ILO modelled estimates, Nov. 2025 (%) | Annual | |
|
▸
Share of youth not in employment, education or training (ILO modelled estimates)
1 table
|
||
| Share of youth not in employment, education or training (NEET) by sex -- ILO modelled estimates, Nov. 2025 (%) | Annual | |
|
▸
Unemployment (current ILO definition)
2 tables
|
||
| Unemployment by sex and age -- 19th ICLS (thousands) | Annual | |
| Unemployment by sex and age -- 19th ICLS (thousands) | Quarterly | |
|
▸
Unemployment rate (current ILO definition)
4 tables
|
||
| Unemployment rate by sex and disability status -- 19th ICLS (%) | Annual | |
| Unemployment rate by sex and disability status -- 19th ICLS (%) | Quarterly | |
| Unemployment rate by sex and age -- 19th ICLS (%) | Annual | |
| Unemployment rate by sex and age -- 19th ICLS (%) | Quarterly | |
|
▸
LU2: Combined rate of time-related underemployment and unemployment (current ILO definition)
2 tables
|
||
| Combined rate of time-related underemployment and unemployment (LU2) by sex and age -- 19th ICLS (%) | Annual | |
| Combined rate of time-related underemployment and unemployment (LU2) by sex and age -- 19th ICLS (%) | Quarterly | |
|
▸
LU3: Combined rate of unemployment and potential labour force (current ILO definition)
2 tables
|
||
| Combined rate of unemployment and potential labour force (LU3) by sex and age -- 19th ICLS (%) | Annual | |
| Combined rate of unemployment and potential labour force (LU3) by sex and age -- 19th ICLS (%) | Quarterly | |
|
▸
LU4: Composite rate of labour underutilization (current ILO definition)
2 tables
|
||
| Composite rate of labour underutilization (LU4) by sex and age -- 19th ICLS (%) | Annual | |
| Composite rate of labour underutilization (LU4) by sex and age -- 19th ICLS (%) | Quarterly | |
|
▸
Potential labour force (current ILO definition)
2 tables
|
||
| Potential labour force by sex and age -- 19th ICLS (thousands) | Annual | |
| Potential labour force by sex and age -- 19th ICLS (thousands) | Quarterly | |
|
▸
Persons outside the labour force (current ILO definition)
2 tables
|
||
| Persons outside the labour force by sex and age -- 19th ICLS (thousands) | Annual | |
| Persons outside the labour force by sex and age -- 19th ICLS (thousands) | Quarterly | |
|
▸
Inactivity rate (current ILO definition)
2 tables
|
||
| Inactivity rate by sex and age -- 19th ICLS (%) | Annual | |
| Inactivity rate by sex and age -- 19th ICLS (%) | Quarterly | |
|
▸
Youth not in employment, education or training (current ILO definition)
2 tables
|
||
| Youth not in employment, education or training (NEET) by sex -- 19th ICLS (thousands) | Annual | |
| Youth not in employment, education or training (NEET) by sex -- 19th ICLS (thousands) | Quarterly | |
|
▸
Share of youth not in employment, education or training (current ILO definition)
2 tables
|
||
| Share of youth not in employment, education or training (NEET) by sex -- 19th ICLS (%) | Annual | |
| Share of youth not in employment, education or training (NEET) by sex -- 19th ICLS (%) | Quarterly | |
Latest posts


Analytical publications
Note: Many publications are available only in English. If available in other languages, a new page will open displaying these options.

Employment and Social Trends 2026
This report examines the state of global labour markets, highlighting stable headline employment alongside stalled progress in job quality and widening inequalities. The report analyses productivity, demographic and economic pressures shaping work in the year ahead and outlines the challenges to achieving more inclusive growth.
New data shine light on gender gaps in the labour market
A new indicator developed by the ILO finds that women’s access to employment, working conditions and pay gap have barely improved in the past two decades.
Persons outside the labour force: How inactive are they really?
Inactivity rates are increasing around the world, while the global population and labour force are ageing. But the inactivity rate is an aggregate measure overlooking the different profiles of people outside the labour force. This Spotlight on Work Statistics explores the characteristics of the potential labour force, made up of persons outside the labour force with an attachment to the labour market.
Avoiding unemployment is not enough
Discover the patterns around the world of unemployment and other forms of labour underutilization, including time-related underemployment, the potential labour force and over-education in the fourth issue of our series Spotlight on Work Statistics.
What about seniors?
Learn about the situation of older persons in the labour market in this brief, the first issue of our new series Spotlight on work statistics where we use ILOSTAT data to explore various labour market issues.
Methods
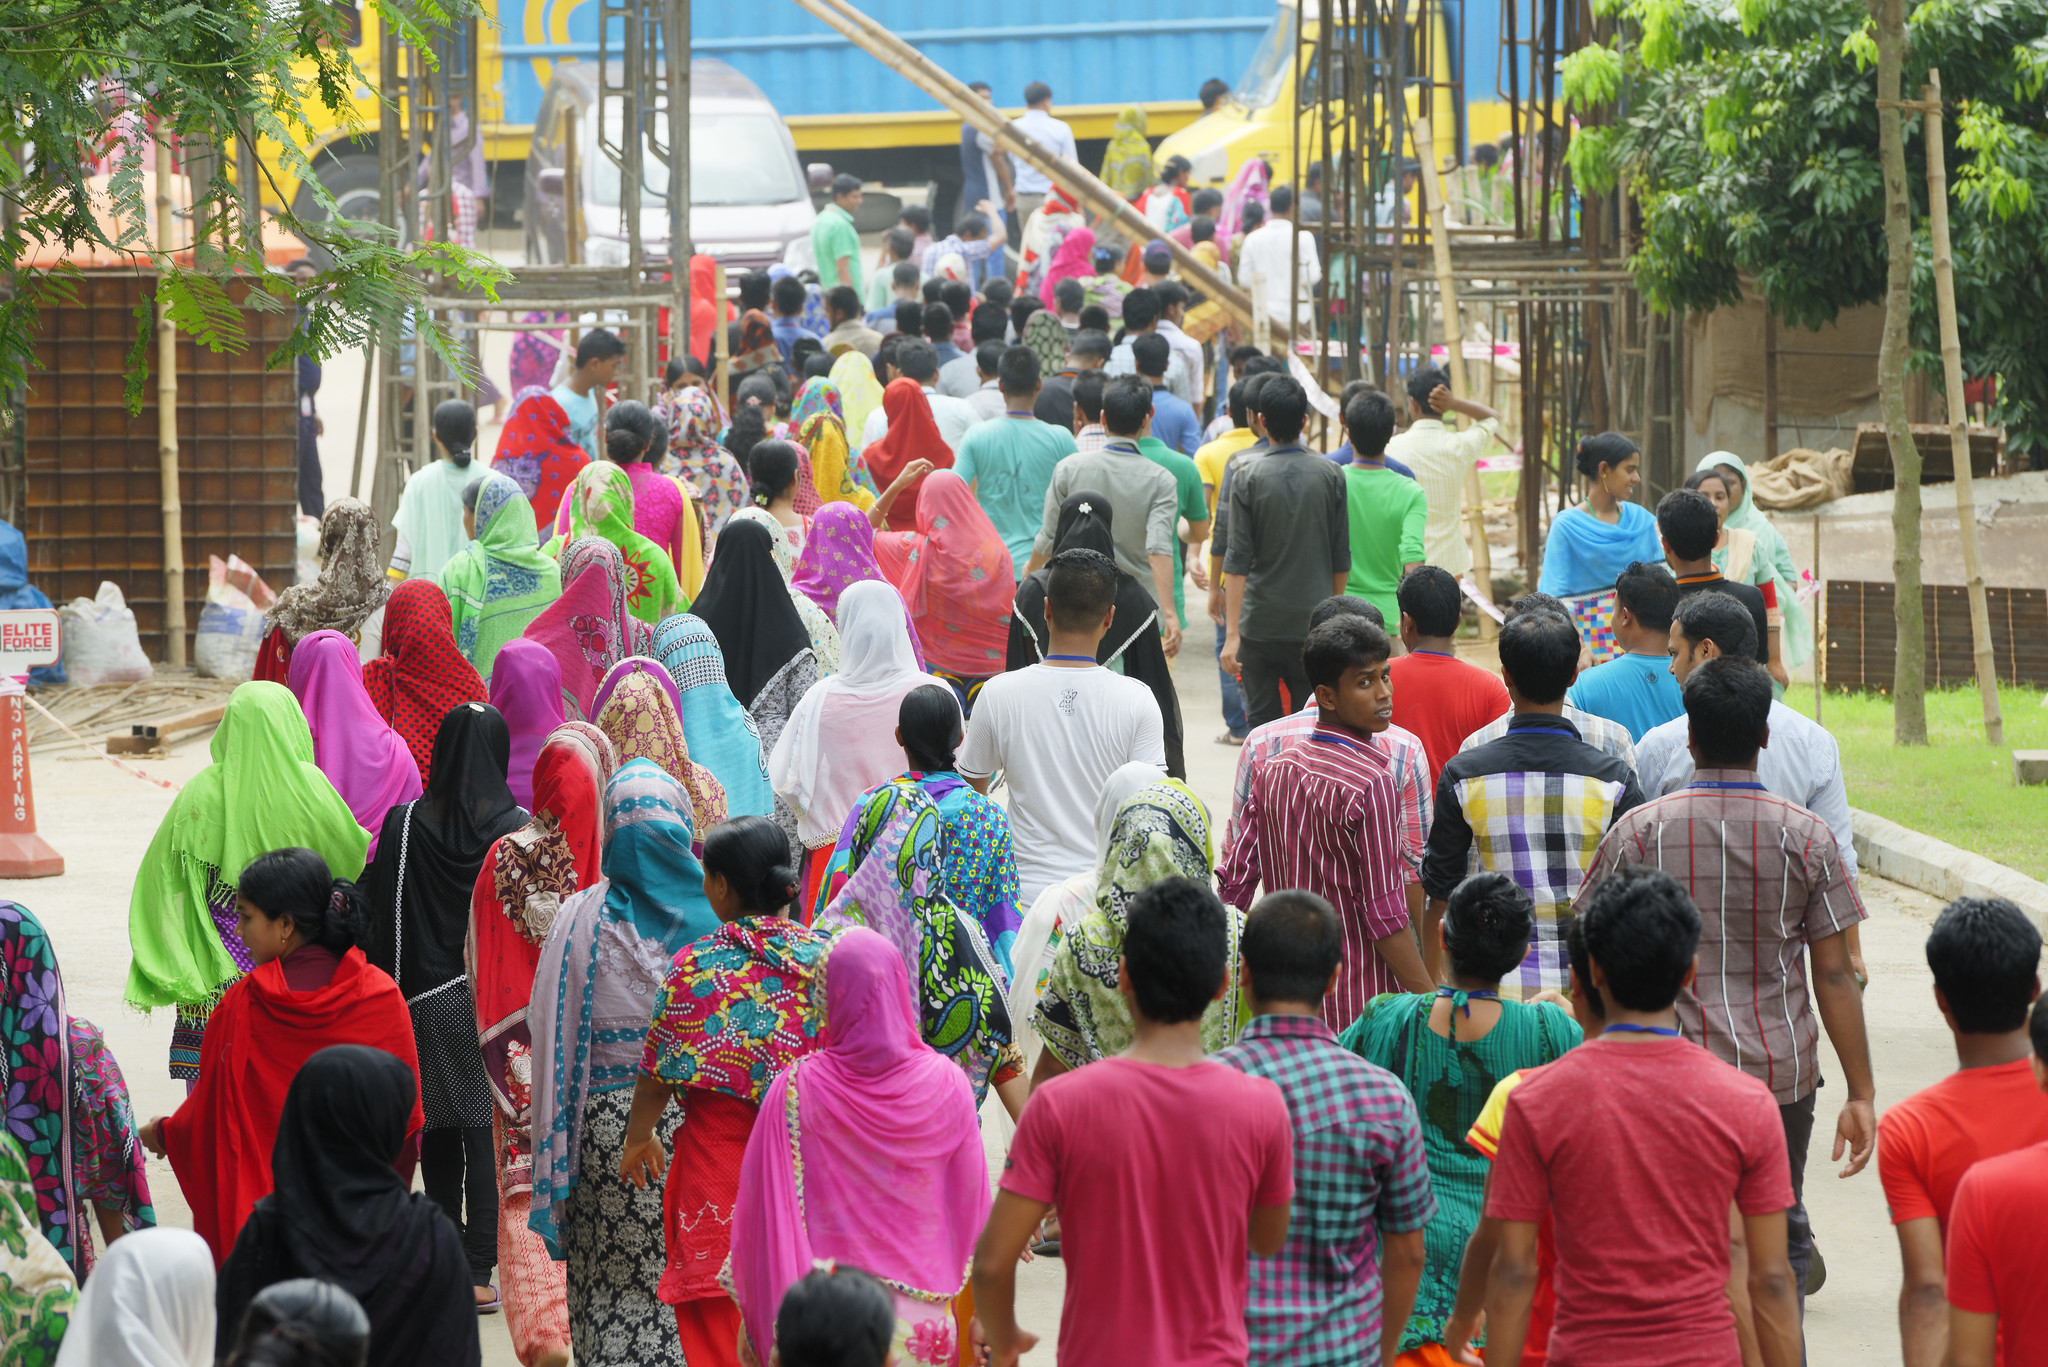
Labour Force Statistics (LFS, STLFS, RURBAN databases)
Concise description of concepts and definitions, uses, sources and limitations for labour force statistics in various databases (LFS, STLFS, RURBAN).
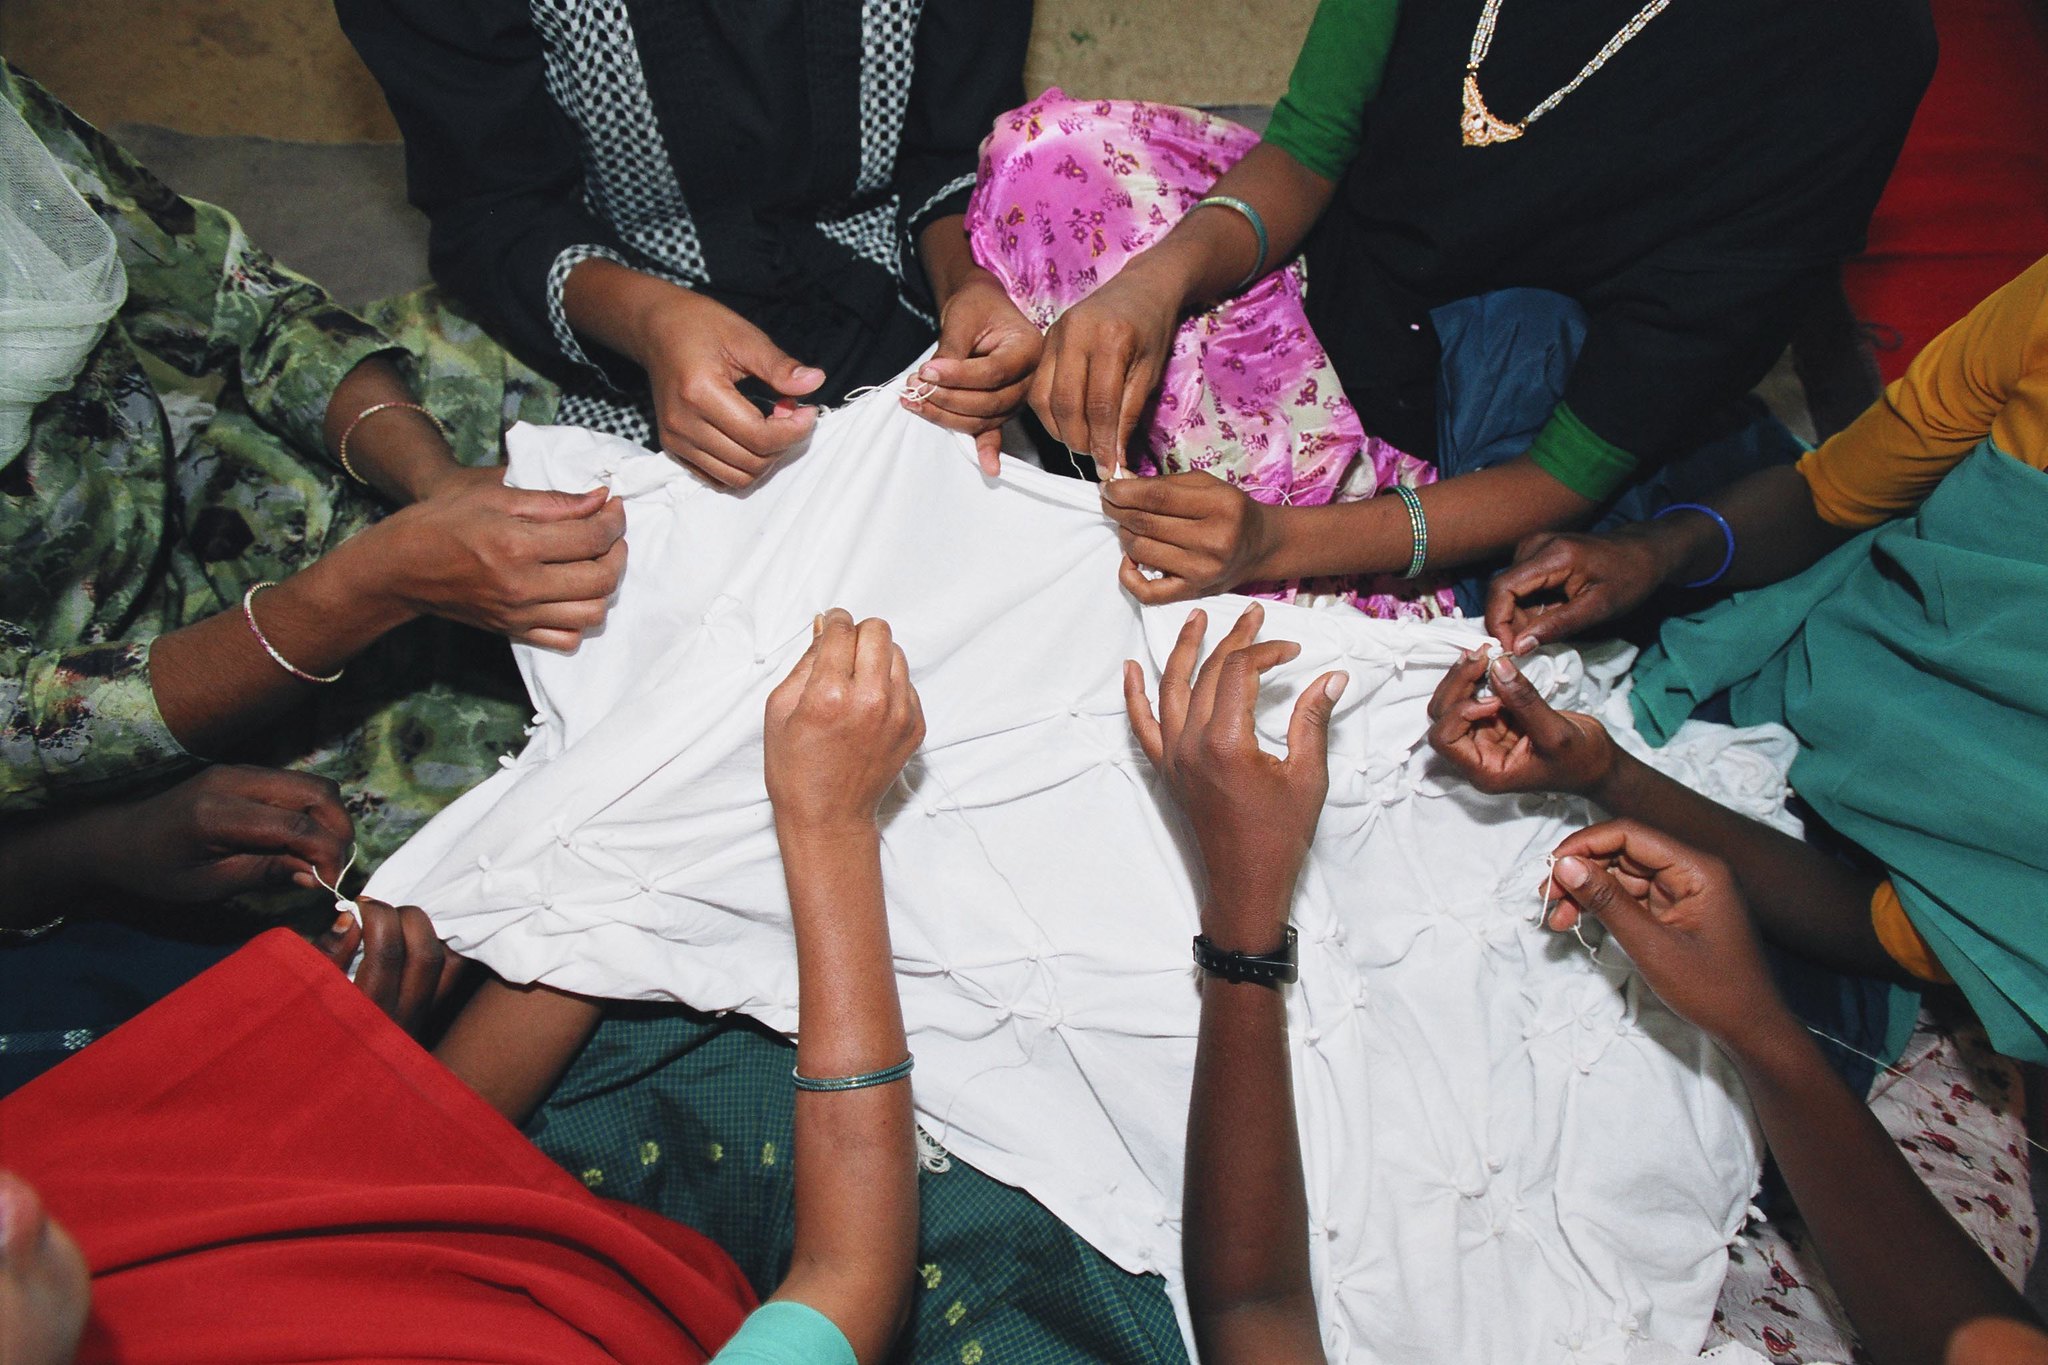
Work Statistics – 19th ICLS (WORK database)
Concise description of concepts and definitions, uses, sources and limitations for (paid and unpaid) work statistics based on the 19th ICLS standards.

Labour Market-Related SDG Indicators (ILOSDG database)
Concise description of concepts and definitions, uses, sources and limitations for labour market-related sustainable development indicators.

ILO Modelled Estimates (ILOEST database)
Discover the methods behind the ILO’s modelled estimates on labour force statistics (including the working poor), labour productivity, wage growth and labour migration.
Quick guide on the communication of results after implementation of latest standards on statistics of work, employment, and labour underutilization
A crucial aspect of the implementation of latest labour statistics standards is the effective communication of the results, to ensure getting the best out of the data. This guide aims to provide practical data visualization examples to convey clearly and intuitively the impact of methodological changes on key labour indicators following the implementation of the 19th ICLS resolution and avoid misinterpretation of the results.
The jobs gap: Measuring labour underutilisation beyond unemployment
This issue of Spolight on Work Statistics discusses an indicator recently developed by the ILO – the jobs gap – which is shown to be an important complement to the unemployment rate. The indicator is particularly relevant to assess the difficulties that women face in finding a job and highlights job creation challenges in the developing world.
Quick guide on interpreting the unemployment rate
The unemployment rate is a key labour market indicator, but it has many shortcomings which we must take into account when interpreting it. The Quick guide on interpreting the unemployment rate provides helpful information on all the main aspects underlying this headline indicator and its limitations. It also provides tips to communicate effectively on the unemployment rate.
Decent Work and the Sustainable Development Goals: A Guidebook on SDG Labour Market Indicators
This Guidebook provides a detailed overview of the labour market indicators included in the Sustainable Development Goals Global Indicator Framework. It is intended to serve as a manual of best practices for calculating and interpreting the SDG labour market indicators, with a view to monitoring progress made at the national and international levels towards the achievement of the SDGs.
Key Labor Market Indicators: Analysis with Household Survey Data
This publication is an introduction to labour market indicator analysis and a guide for analysing household survey data using the ADePT ILO Labour Market Indicators Module. The ADePT module is a powerful tool for producing and analysing KILM indicators using household survey data. The software allows researchers and practitioners to automate data production, to minimize data production errors and to quickly produce a wide range of labour market data from labour force surveys or other household surveys that contain labour market information.
Decent Work Indicators – Guidelines for producers and users of statistical and legal framework indicators
This manual presents guidelines on the decent work statistical indicators and legal framework indicators. It is divided into eleven chapters which correspond to the ten substantive elements of decent work as well as to the economic and social context for decent work.
Resolution concerning statistics of work, employment and labour underutilization (including amendments)
Adopted by the 19th ICLS (2013), this resolution sets standards for work statistics to guide countries in updating and integrating their existing statistical programmes in this field. It defines the statistical concept of work for reference purposes and provides operational concepts, definitions and guidelines for: (a) distinct subsets of work activities, referred to as forms of work; (b) related classifications of the population according to their labour force status and main form of work; (c) measures of labour underutilization.
Sources and Methods Volume 5: Population censuses (2004) – Total and economically active population, employment and unemployment
This volume is an updated version of the second edition issued in 1996 which presented national methodological descriptions of population censuses carried out during the period 1989-94 in 115 countries, areas and territories. The first edition issued in 1990 covered the period 1945-89.
Sources and Methods Volume 4: Administrative records and related sources (2004) – Employment, unemployment, wages and hours of work
This volume presents national methodological descriptions of statistics of employment, unemployment, wages and hours of work, derived from administrative records and related sources. It is a revised and updated version of the first edition issued in 1989, and contains 124 descriptions in respect of 102 countries, areas and territories.
Sources and Methods Volume 3A: Household surveys (2004) – Economically active population, employment, unemployment and hours of work
This volume presents national methodological descriptions of statistics of employment, unemployment, underemployment, hours of work and other indicators derived from labour force and household surveys, disseminated on ILOSTAT. It is a revised and updated version of the second edition issued in 1990. This third edition contains descriptions for 83 countries.