
ILOSTAT has a wealth of information on labour statistics, from free access to almost 100 million data points to extensive statistical guidance. Below are tips on getting started with finding data and statistical resources.
Please note the site works best in Chrome. Some features and/or content may not be available on mobile.
Site navigation
Menus
The top-level menu provides access to the main items available on the ILOSTAT site – data, country profiles (a subset of the available data) and resources.
Click on the hamburger menu for additional navigation options. It provides quick access to the most widely used pages, including esources for data producers, analytical products, events and training, and information about us, as well as the language switcher. The site is available in English, French and Spanish.
Search
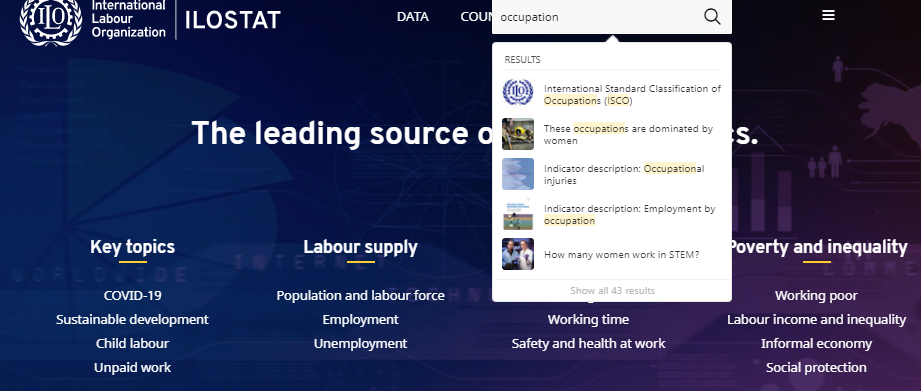
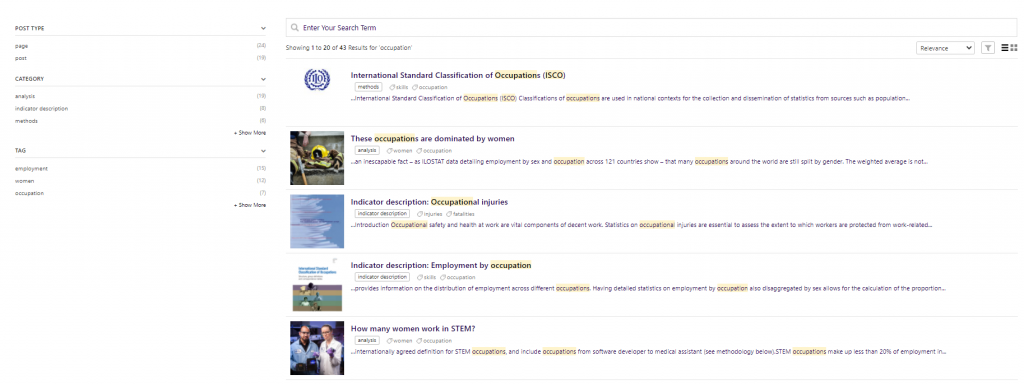
Search the site and filter the results by post type (page, blog post or pdf), category (e.g., methods) and tag (e.g., employment). Below is an example search for the term “occupation”. Note the search is for site content, including links to pdf documents, but it is not for access to data files contained within the data catalogues. To find data for an indicator or country, use the data, country profiles or topic pages.
Home

Go back to the ILOSTAT homepage by clicking on the ILOSTAT section of the logo in the top left corner of the site. To go to the ILO site, click on the ILO section of the logo.
Topics
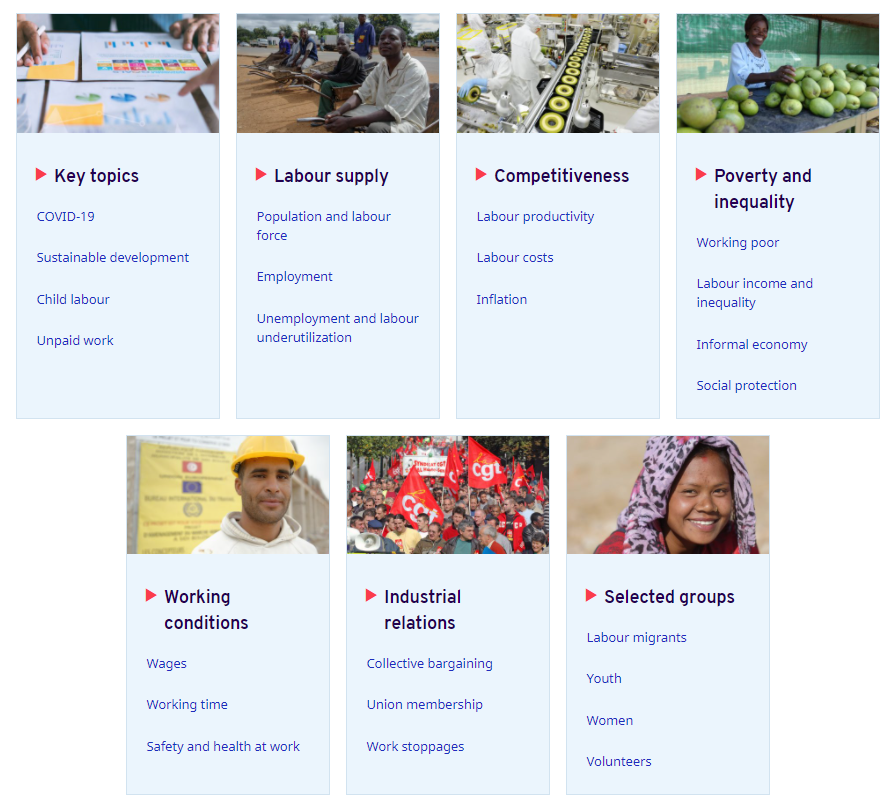
Topic pages serve as entry points for all of the statistical information available for each topic listed and includes access to data, methods and analysis. The list of topics is available from the homepage and hamburger menu (selected topics > see all).
On topic pages, the indicators displayed in the “Data” section are a subset of what is available. For the complete list, refer to the data catalogue on the data page.
Data catalogues
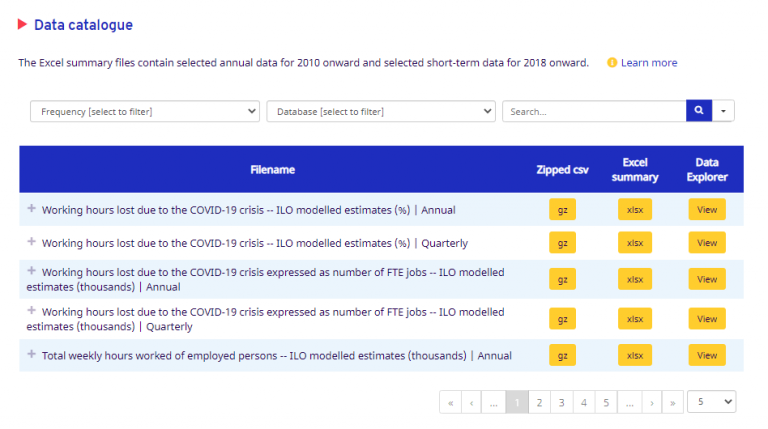
On the topic pages, the data catalogue provides access to all indicators related to that topic.
On the data page, the indicator catalogue provides access to all data available for a specific indicator, while the country catalogue provides access to all data available for a specific country or region.
On the regional pages (e.g., Statistics in the Americas), the indicator catalogue provides access to data for a given indicator only for the countries available in that region. In the country catalogue, only the countries in that region are listed.
Filters
The filters above the table allow users to reduce the list of indicators displayed in the data catalogues:
- Filter by database or subject. See descriptions of our databases.
- Filter by frequency. This is whether it refers to annual or short-term (monthly or quarterly) data. It is not to be confused with the periodicity of data collection or data dissemination.
- Search using key words. See database search terms for tips on using the right key words.
TIP: For best results, select either a database, subject or frequency AND enter key words. Otherwise the list of search results is likely to be long. Also note the search is limited to the words within the indicator label, description and other metadata (e.g., subject) and must match text available in these fields. It does not search for synonyms.
Click on the Reset button to remove all filters applied.
Browsing the list
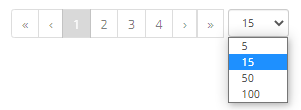
Scroll through the pages of the data catalogue by using the numbers or arrows below the table. Use the drop-down menu to change the number of indicators displayed on each page.
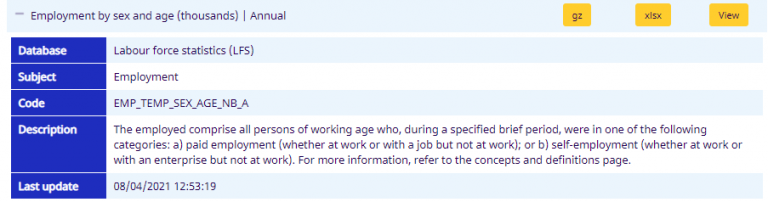
Learn more about an indicator by clicking on the + sign to the left of the indicator label. Below is an example of the additional information available.
Data access options
Once you find an indicator, you have various options to access data from the catalogue. Viewing data in the Data Explorer provides an intutive interface to fitler, reshape and download data.
Otherwise you can directly download files with and without codes in various formats as listed.
More options to access data are provided in the data tools section. For more info, see about our data tools.
Data explorer
The data explorer provides access to all of the data available in ILOSTAT. It is a standalone application and requires enabling Flash. If your environment does not allow for the application to run properly, you can use the data catalogue to access summary tables in Excel or zipped csv files or select another data tool from the data page.
Indicator selection
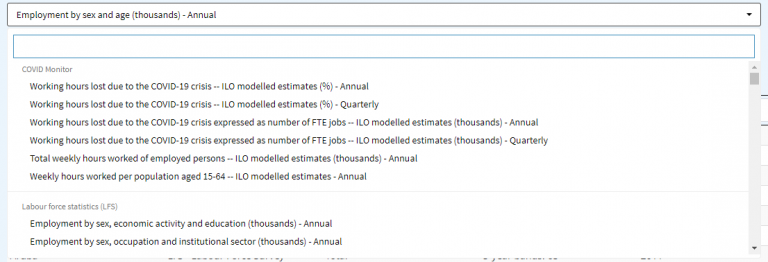
Change the dataset by using the drop-down menu to the right of the indicator label.
A search bar will appear above the list of indicators. Enter key words keeping in mind you will only get results found in the indicator label.
Use the scroll bar to see more indicators. The indicators are organized by database.
Indicator description

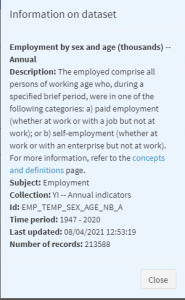
Click on the i icon to get more information about the dataset.
A pop up will appear with the indicator description and other related information. The description will include a link to more information on the concepts and definitions page.
Filters
On the left side of the data explorer, the filters must be used in the order in which they appear because they are reactive. That is, the country selection will impact the choices available in the filters that follow.
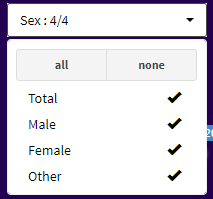
TIP: By default, all possible records are displayed. Before selecting a subset of the items in a drop-down menu, click “none” to uncheck all items.
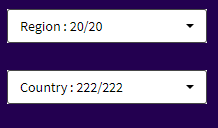
Selecting regions will automatically pre-select the countries in those regions in the next filter.
The “Country” filter is called “Reference area” for indicators in the database “ILO modelled estimates and projections” because it also includes world and regional aggregates.
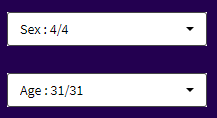
Select classification items. These are often organized by groups. For example, the age classification provides items grouped as 5 year age bands (ages 15-19, 20-24, 25-29, 30-34 etc.), 10 year age bands (ages 15-24, 25-34, 35-44 etc.) and aggregate age bands (youth, adults etc.). Please note available age bands differ by indicator.
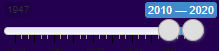
By default, the time range is set to the latest 10 years for annual data (or less if fewer years are available). You can check the box to get the latest period only. This means for each country, only the latest year with data will be shown. The latest year may differ by country. Also note the latest period provided will be within the selected time range.

Check the box to get the latest period only. This means for each country, only the latest year with data will be shown. The latest year may differ by country. Also note the latest period provided will be within the selected time range.
Below the filters is an indication of the number of records available based on the filters selected out of the all of the possible records.
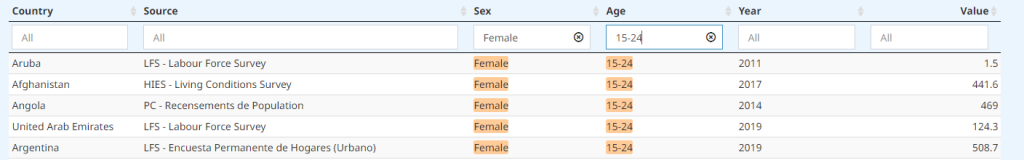
You can also filter the columns in the data table in the fields marked with “All” between the header and rows. Below is an example table filtering the sex column for “female” and age column for “15-24”. You must type the words as they appear in that column (i.e., no typos or synonyms).
Notes
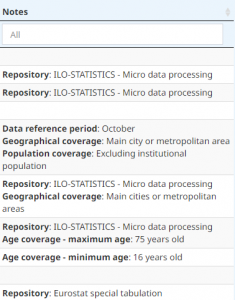
Check this box to view all of the notes related to a record. It will add a column at the right of the table as shown below.
This option cannot be combined with the pivot option.
Advanced options
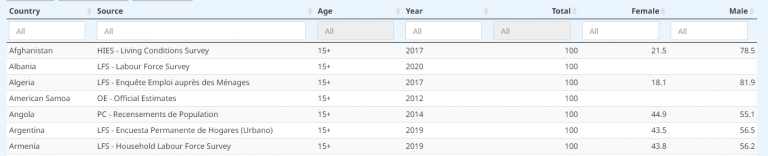
Options to calculate distributions and to pivot the table contents are available below the filters. These features are often best used together. Below is an example of a distribution by sex (i.e., male and female share of employment) with a pivot also by sex (i.e., sex moved to the columns instead of rows).
There is also an option to calculate growth rates. This option is most useful when also pivoting the time dimension.
Calculate distributions
For level figures, calculate distributions for any of the classifications shown. You must select the total and at least one more item within the classification.
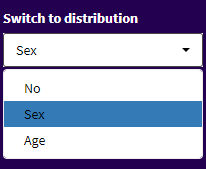
For example, to do a distribution by sex, select “total” and at least one of the other classifications items (e.g., “female”) in the filter section above. Then use the distribution drop-down menu to select “sex”.
The distribution by sex is the percentage share of each sex. In other words, it is calculated as female / total * 100 and male / total * 100.
Pivot a dimension
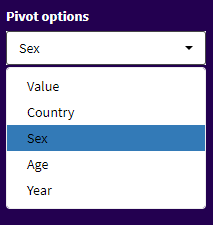
Pivot one of the dimensions in the table (e.g., country, year or one of the classifications) so the selected item is shown in columns instead of rows. By default, the data table shows all items in rows. This means there is only one value shown per row.
You can now pivot up to two items to be shown in columns.
Note this option cannot be combined with checking the notes box since different notes may apply across the values in the row when pivoted.
Calculate growth rates

On level figures, this option will calculate the growth rate as a percentage. On rates, this option will calculate the percentage point difference.
Download
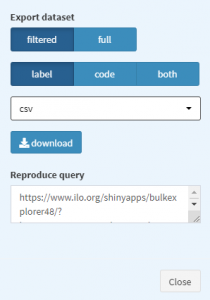
Export data in one of the formats listed.
While Excel is not listed, data in csv files will open in Excel.
Select whether you want the entire dataset (i.e., full) or the subset of records based on your filters (i.e., filtered). Then click on “Download”.
The section “Reproduce query” allows users to re-use the link displayed to return to the same filtered data table. Note it does not retain any distributions or pivoting applied.
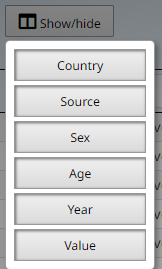
This option is used to hide and show columns. It is best used prior to capturing a view (see just below). Click on any of the items listed to hide that column. Click again to show it.
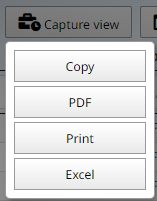
Capture view allows users to make a copy of the currently displayed (i.e., filtered) data table, which then can be pasted elsewhere, such as an email.
Other output options include PDF, print and Excel.
When using the options “Copy” and “Excel”, you can use the function CTRL+V to paste the contents.
Other features
Change the number of entries shown per page below the data table. Use the numbers or “Next” button to navigate through the pages.
Click on the newspaper icon in the top right to learn about the latest updates.
Resources
The resources page provides access to a variety of statistical resources, including statistical guidance on labour statistics for data producers.
One of the key resources for data users and data producers is the concepts and definitions page, which includes links to statistical standards adopted by the ICLS, a glossary, indicator descriptions (with concise descriptions of concepts and definitions, uses, sources and limitations), and guides and manuals with more in-depth guidance.
The More+ menu item offers a list of additional resources, including quick links for data producers. Data producers may also be interested in the events and training section.
To easily share content, select one of the options provided from the social sharing floating bar on the right side of the site.
Click on the arrow at the bottom to hide the floating bar. Click on it again to make it reappear.
Print the page with a print-friendly layout by clicking on the turquoise button with a printer icon.
Click on the orange button with a share icon to get additional options. A pop up as shown below will appear.
Learn more
About our data tools
The data page contains links to a variety of data tools targeted towards different types of data users.
The main data tool is the Data Explorer, which is explained on this page. Many users also download the summary Excel files. Excel users can also download an add-in to access data directly in Excel.
For those seeking to use the data in an automated way, we recommend the bulk download facility, R package and SDMX-based APIs. Refer to the data page for more info.
Database search terms
| If you are looking for data on... | Use this key word: |
|---|---|
| women, men, gender, female shares | sex (note the data explorer allows users to calculate female shares based on level figures) |
| youth, older workers, prime-age workers or other age group | age |
| sectors, industries, ISIC, specific economic activities such as manufacturing, accommodation etc. | economic activity (note data are available up to the 2-digit level of ISIC) |
| skill levels, ISCO, specific occupation such as teachers, doctors etc. | occupation (note data are available up to the 2-digit level of ISCO) |
| migrants | country of birth or country of citizenship |
| working parents | household type |
| working poor/poverty | economic class |
| wages, income, salaries, pay | earnings |
| precarious employment, non-standard forms of employment | type of contract |
| vulnerable employment | status in employment or informality |
Note that we may not have the data you seek. For example, ILOSTAT does not include indicators on the following: anything not specific to labour, work-related stress, violence at work, annual hours (we have data on weekly hours), layoffs or job turnover (we have data on unemployment), platform workers, and green jobs.
About our databases
Each database is hyperlinked to a description, which provides concepts and definitions, data sources, interpretation and uses, and limitations.
| Database | Description | Update schedule |
| Labour Market-related SDG Indicators (ILOSDG) | Sustainable Development Goal (SDG) labour market-related indicators on working poverty, social protection, informal employment, unemployment, women in management, earnings, occupational injuries and child labour | Continuous except for social protection and child labour (February) |
| Prices, Costs and Currency Conversions (PRICES) | Indicators on consumer prices, labour costs, and currency conversion factors (purchasing power parities and exchange rates) | Continuous |
| Labour Force Statistics (LFS) | Labour force statistics from national household surveys including indicators on employment, unemployment, and measures of labour underutilization | Continuous |
| Short Term Labour Force Statistics (STLFS) | Monthly and quarterly labour force statistics from national household surveys including indicators on employment, unemployment, working time, and monthly earnings | Continuous |
| ILO Modelled Estimates and Projections (ILOEST) | Global, regional, and country-level modelled estimates of the labour force, employment (by economic activity, by status in employment and by occupation), unemployment, wage growth, and labour productivity | January with launch of WESO report |
| Work Statistics — 19th ICLS (WORK) | Work statistics based on the new statistical standards (from the 19th ICLS), including data on paid work (e.g., employment) and unpaid work (e.g., subsistence foodstuff production work and volunteer work) | Continuous |
| Industrial Relations data (IRdata) | Trade union membership, collective bargaining and industrial disputes (strikes and lockouts) | About every 2 years; last update from spring 2022 |
| Wages and Working Time Statistics (COND) | Working time and arrangements (hours, part-time and temporary employment), earnings, and minimum wages | Continuous |
| Education and Mismatch Indicators (EMI) | Labour market indicators broken down by education including cross-tabulations by occupation to assess mismatches | Continuous |
| Gender Equality and Non-Discrimination Indicators (GEND) | Gender-related indicators including breakdowns by marital status and household type (note this is a subset of data available by sex) | Continuous |
| Disability Labour Market Indicators (DLMI) | Labour market indicators broken down by disability status | Continuous |
| Youth Labour Market Indicators (YouthSTATS) | Selected labour market indicators (labour force, employment, unemployment, school-to-work transitions, working time and earnings) with detailed breakdowns focused on youth ages 15 to 29 | Continuous |
| Occupational Safety and Health Statistics (OSH) | Indicators on fatal and non-fatal injuries at work, including days lost, and labour inspection | Continuous |
| Rural and Urban Labour Market Statistics (RURBAN) | Labour market indicators broken down by rural and urban areas | Continuous |
| International Labour Migration Statistics (ILMS) | Labour migrant stocks, inflows and outflows | December |
| Child Labour Statistics (CHILD) | Statistics on child labour, including the child labour rate and hazardous work, broken down by sex, age and rural/urban | Ad hoc |
You can also select “countries” or “regions” to view all data available for a country or region. For regions, the only available indicators are from the database “ILO estimates and projections.”
Continuously updated databases are updated for the public once a week, every Sunday at 10:00 pm (Europe/Paris time zone). The updating procedure only involves tables for which there is new data or that have undergone a modification or a structural change.
Database tips
ILO data on labour and the world of work is now part of a new global platform that is accessible to the UN and the world at large.
The framework on work statistics has been widely publicized over the years, particularly to data producers and policymakers, as it was designed to improve labour market and gender analysis. But little has been said to data users interested in international comparisons. Until now. Here is the ILOSTAT solution to handling the impacts of revised definitions occurring on different schedules across the globe.
Containing more than 100 million data points, the ILOSTAT portal is truly a gold mine for seasoned data scientists, but it can be challenging to use for those with less experience. Here we explain five typical rookie mistakes so you can avoid them.