
In March 2021, the ILO undertook a global survey of national data producers to understand the impacts of the pandemic on their statistical operations particularly in the domain of labour statistics.

This brief highlights 5 key areas where strong and decisive action is required to achieve sustainable improvement in the availability of key gender data, including in the world of work.

Working from a distance and working at home are not new phenomena but the relevance of their measurement has increased, not least due to the Covid-19 pandemic. This notes provide guidance to data producers on how the four different concepts of remote work, telework, work at home and home-based work should be statistically understood, how they relate to each other, and how they can be measured through a household survey.

Lack of data on how households and workers are being impacted by the pandemic can severely affect the formulation of programmes and policies aimed to help those most in need. In times of crisis, rapid surveys may be an alternative source of information where official household surveys such as LFS have been halted or postponed. This note provides modules for rapid surveys to shed light on the COVID-19 impacts on paid and unpaid work.
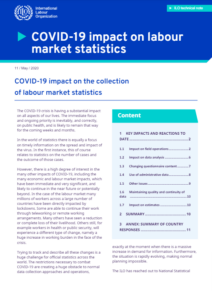
The restrictions necessary to combat COVID-19 pose a huge obstacle to data collection operations, precisely when there is a massive increase in demand for information. The ILO reached out to national data producers to understand the impacts of the pandemic on their statistical operations particularly in the domain of labour statistics. Last update: May 2020

The most immediate impact of the pandemic on LFS data collection for most countries is the suspension of face-to-face interviewing. This note provides guidance to countries on the range of options available and challenges to deal with in order to change their data collection approach and maintain continuity in data availability.

The COVID-19 crisis is affecting data collection activities of national statistical offices (NSOs) around the world, including for consumer price indexes (CPI).
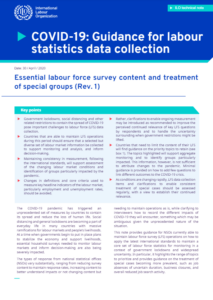
International standards are still sound reference, but due to this unprecedented pandemic, this note provides guidance to data producers to maintain labour force survey (LFS) operations. It highlights the range of topics to prioritize in national LFS and suggested clarifications to support consistent treatment of special cases becoming more prevalent, such as job absences of uncertain duration, business closures, and overall reduced job search activity.