Overview
Labour force statistics and the related ILOSTAT databases serve as a foundation for monitoring and assessing many of the pertinent issues related to the functioning of labour markets. However, recent changes in statistical standards have had a major impact on data comparability over time and across countries. For labour force statistics, major changes occurred between the standards adopted at the 13th International Conference of Labour Statisticians (ICLS) in 1982 and those adopted three decades later at the 19th ICLS in 2013. Most notably, the Resolution concerning statistics of work, employment and labour underutilization expanded the scope of labour statistics by recognizing the need to collect data on different forms of work, both paid and unpaid. To this end, employment was defined more narrowly as work done for pay or profit, while activities not done in exchange for remuneration (i.e., own-use production work, volunteer work and unpaid trainee work) were recognized as other forms of work.
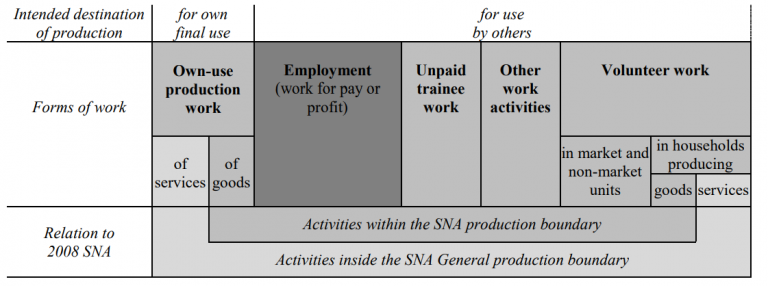
In the new framework, work comprises any activity performed by persons of any sex and age to produce goods or to provide services for use by others or for own use. It includes five mutually exclusive forms of work:
- own-use production work, comprising production of goods and services for own final use;
- employment, comprising work performed for others in exchange for pay or profit;
- unpaid trainee work, comprising work performed for others without pay to acquire workplace experience or skills;
- volunteer work, comprising non-compulsory work performed for others without pay; and
- other work activities.
To address the challenges posed by evolving statistical standards, databases on ILOSTAT are now separated based on concepts and definitions, among other factors. This is a description of the concepts and definitions for indicators available in the WORK database, which are based on the 19th ICLS standards. These differ from those of the LFS and related databases, which are based on the 13th ICLS standards. Although the more recent statistical standards are from the 19th ICLS, most countries currently follow the 13th ICLS standards. Users should also note that most data in this database are not comparable to those in databases based on the 13th ICLS. For more information, refer to the Quick guide to understanding the impact of the new statistical standards on ILOSTAT databases.
Employment and labour force indicators
Introduction
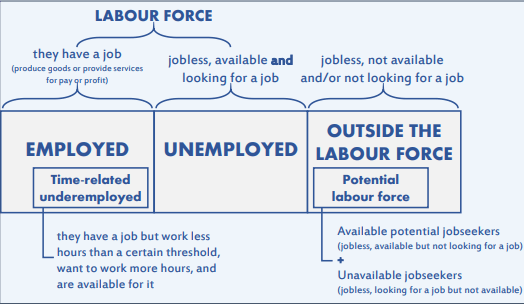
In the framework on labour force statistics, employment is the reference scope of activities for labour force statistics. More precisely, the working-age population is categorized into mutually exclusive labour force groups – employed, unemployed, or outside the labour force.
Concepts and definitions
The following are definitions for the key concepts used in labour force statistics:
Combined rate of time-related underemployment and unemployment (LU2): represents the share of the labour force that is either in unemployment or time-related underemployment.
Combined rate of unemployment and potential labour force (LU3): represents the share of the extended labour force that is in unemployment or the potential labour force.
Composite measure of labour underutilization (LU4): represents the share of the extended labour force that is in unemployment, time-related underemployment, or the potential labour force.
Employment: defined as all those of working age who, during a short reference period, were engaged in any activity to produce goods or provide services for pay or profit. They comprise employed persons “at work”, i.e., who worked in a job for at least one hour and employed persons “not at work” due to temporary absence from a job or because of working-time arrangements (such as shift work, flexitime, and compensatory leave for overtime).
Employment-to-population ratio: the share of the working-age population that is employed.
Extended labour force: defined as the sum of the potential labour force and the labour force. It includes persons of working age who, during the short reference period, were neither in employment nor in unemployment and: (a) carried out activities to “seek employment”, were not “currently available” but would become available within a short subsequent period established in the light of national circumstances (i.e. unavailable jobseekers); or (b) did not carry out activities to “seek employment”, but wanted employment and were “currently available” (i.e. available potential jobseekers).
Labour force: comprises all persons of working age who furnish the supply of labour for the production of goods and services during a specified time-reference period. It refers to the sum of all persons of working age who are employed and those who are unemployed.
Labour force participation rate: the share of the working-age population that is in the labour force.
Labour underutilization: refers to mismatches between labour supply and demand, which translate into an unmet need for employment among the population. There are several measures of labour underutilization including unemployment, time-related underemployment, the potential labour force, and the LU1-LU4 rates.
Outside the labour force: includes working-age persons neither in employment nor in unemployment.
Potential labour force: a subset of persons outside the labour force, which aims to measure the potential supply of labour, or in other words, it quantifies all persons with an unmet need for income-generating work and provides a measure of their degree of labour market integration. It includes persons who are either looking for a job but not currently available to work, or who are available to work but are not actively looking for a job.
Time-related underemployment: defined as all persons in employment who wanted to work additional hours, whose working time in all jobs was less than a specified hours threshold, and who were available to work additional hours given an opportunity for more work.
Unemployment: includes all working-age persons who were not in employment, carried out activities to seek employment during a specified recent period and were currently available to take up employment given a job opportunity.
Unemployment rate (LU1): the share of the labour force that is unemployed.
Working-age population: refers to persons of working age, which is commonly defined as those aged 15 years and older, although the age limits can vary.
These concepts are also discussed in the LFS database description.
Method of computation
- Labour force participation rate = Labour force / Working-age population x 100
- Employment to population ratio = Persons employed / Working-age population x 100
- LU1: Unemployment rate = Persons unemployed / Labour force x 100
- LU2: Combined rate of time related underemployment and unemployment = (Time-related underemployed + Persons unemployed) / Labour Force) x 100
- LU3: Combined rate of unemployment and potential labour force = (Persons unemployed + Potential labour force) / Extended labour force x 100
- LU4: Composite measure of labour underutilization = (Time-related underemployed + Persons unemployed + Potential labour force) / Extended labour force x 100
Data sources
In general, household-based surveys are best suited for collecting statistics of work and of the labour force covering the resident population, their participation in all jobs and in all forms of work – in particular, work in the informal economy, own-use production work, unpaid trainee work and volunteer work.
Labour force surveys are the main type of household surveys used to derive labour statistics, since they are designed specifically for that purpose. The labour force survey questionnaires allow to properly investigate the desired labour-related topics with enough probing questions to ensure the accuracy of the results. However, other household surveys, such as household income and expenditure surveys or time-use surveys, can be used as well, provided they include a corresponding labour module. For more information, refer to the Quick Guide on Sources and Uses of Labour Statistics.
The labour force statistics in this database are solely derived from household surveys, usually labour force surveys, and are mainly produced by the ILO through microdata processing. The main principles and methods underlying the ILO’s processing of microdata are provided in the ILOSTAT Microdata Processing Quick Guide. Among the many benefits, microdata processing allows the ILO to ensure a higher level of compliance with internationally agreed concepts, standards, definitions, and classifications, favouring the harmonization and comparability of data across countries and over time. This has been particularly crucial following the changes in statistical standards with the 19th ICLS. For further information, refer to the Quick guide to understanding the impact of the new statistical standards on ILOSTAT databases.
Additional potential sources of data are discussed in the 19th ICLS Resolution.
To address the challenges posed by evolving statistical standards, databases on ILOSTAT are now separated based on concepts and definitions, among other factors. This is a description of the concepts and definitions for indicators available in the WORK database, which are based on the 19th ICLS standards. These differ from those of the LFS and related databases, which are based on the 13th ICLS standards. Although the more recent statistical standards are from the 19th ICLS, most countries currently follow the 13th ICLS standards. Users should also note that most data in this database are not comparable to those in databases based on the 13th ICLS. For more information, refer to the Quick guide to understanding the impact of the new statistical standards on ILOSTAT databases.
Interpretation and uses
Refer to the LFS database description for the interpretation and uses by indicator.
Limitations
Labour force statistics may not be comparable owing to differences in concepts and methodologies. The single most important factor affecting data comparability is the data source. However, the data in this database are generally from labour force surveys as indicated in the data source section, thus reducing the potential impact of comparability issues stemming from differing sources. Moreover, the ILO processing of microdata ensures the consistent application of international standards to the extent possible, thereby reducing differences in definitions. Some differences can remain due to the coverage of the source or the frequency of data collection.
Estimates produced by the ILO through microdata processing may differ from those derived and published at the national level. ILOSTAT data users can identify figures published from ILO microdata processing in the notes accompanying the data. The thresholds established by the ILO to evaluate the reliability of estimates may differ from those that are set at the national level. In most cases, thresholds used by the ILO are stricter than the national ones, and therefore the dissemination of information is more limited.
Own-use production work
Introduction
The new forms of work framework introduced the concept of own-use production work, of both goods and of services (better known as own-use provision of services).
Concepts and definitions
Own-use work refers to the production of goods and provision of services for own final use. It distinguishes own-use from market-oriented production based on the intended destination of output. Persons in own-use work are therefore defined as all those who performed any activity for at least one hour to produce goods or provide services for their own final use in the form of capital accumulation or for final consumption by household members.
The production of goods includes:
- Producing or collecting goods from agricultural (cultivated crops), forestry (firewood, uncultivated crops, wild berries, nuts, herbs, mushrooms, roots), or animal products (fishing, aquaculture, livestock, bushmeat)
- Processing goods, such as manufactured products (furniture, pottery, baskets, clothing, charcoal, mats or other durables, including boats and canoes) or food and drink (flour, dried fish, meat, butter, cheese, marmalade, spirits, alcoholic beverages)
- Building or effecting major repairs to one’s own dwelling, farm buildings, etc.
- Water fetched from natural or public sources
A subset of own-use producers of goods are subsistence foodstuff producers, which are people producing and/or processing goods from agriculture, fishing, hunting and gathering, as foodstuff that contribute to the livelihood of the household or family. It excludes persons engaged in such production as recreational or leisure activities.
The provision of services includes:
- Household accounting and management, purchasing or transporting goods
- Cleaning, decorating, and maintaining the dwelling occupied by the household, durables and other goods, and gardening
- Preparing and serving meals, household waste disposal, and recycling
- Childcare and instruction, transporting and caring for the elderly, sick, infirm, dependent or other household members and domestic animals or pets
Method of computation
Currently there is only one headline indicator in this database for own-use production, which is for the subset of workers known as subsistence foodstuff producers. Their participation rate is calculated as follows:
- Subsistence foodstuff production rate = (subsistence foodstuff producers)/(working-age population) x 100
Interpretation and uses
The revised standards will allow us to substantially improve our understanding of issues such as the scale of a ‘double burden’ on women (doing both paid and unpaid work).
Limitations
Currently, almost no country covers own-use provision of services, thus providing only a partial view of unpaid work. The ILO is testing potential modules that could be added to labour force surveys.
Volunteer work
Introduction
Volunteer work covers a wide range of unpaid activities performed by individuals to help others, to contribute to their communities, the environment, and to support different organizations.
Available national data shows that people in all regions and from a wide range of social, cultural and economic backgrounds engage in volunteer work. Volunteer work helps everyone – those who volunteer, those who directly benefit from their work, and society at large. It connects people, helping many to avoid exclusion. It also connects communities, helping to alleviate poverty, building resilience, and contributing to the well-being of all.
The 2030 Agenda for Sustainable Development calls on governments to work closely with volunteering groups on its implementation. The UN General Assembly resolution on “Volunteering for the 2030 Agenda for Sustainable Development” (UN, 2019) recognizes “that volunteerism can be a powerful and cross-cutting means of implementation of the 2030 Agenda for Sustainable Development” and encourages countries to “invest in measuring the scale and contribution of people’s voluntary efforts”.
In this context, the ILO supports efforts to achieve the SDGs by offering constituents guidance on how to produce meaningful and reliable statistics on volunteer work following the latest international standards and best practices, and by compiling existing available national data for global dissemination.
Concepts and definitions
According to the latest international standards (see 19th ICLS, Resolution I), “volunteers” includes any person of working age who engages in unpaid, non-compulsory work for others, for at least one hour in a four week or one month reference period.
Unpaid means that volunteers do not receive a remuneration in cash or in kind for the work done or hours worked. Nevertheless, volunteers may receive some small form of support or stipend in cash or in kind usually meant to enable their participation.
Non-compulsory means that volunteers do not engage in this work because of civil, legal or administrative requirements. However, some volunteers may be motivated by social responsibilities of a communal, cultural or religious nature.
For others means that the work done by volunteers benefits a) people other than the volunteer’s household or family; b) organizations that may include market and non-market units, self-help, mutual-aid or community-based groups of which the volunteer is a member, or c) nature or the environment in general.
There are two types of volunteer work:
- Direct volunteer work, which is done to help other people directly (e.g. a neighbour, a friend, a stranger, nature);
- Organization-based volunteer work, which is done through or for an organization, community or group.
Method of computation
The number of volunteers represents the number of persons of working age, who are classified as having done volunteer work for 1 or more hours, in a given reference period.
The volunteer rate represents the share of working-age persons classified as volunteers as a per cent of the working-age population. It is calculated as follows:
Volunteer rate (%) = (number of working-age volunteers)/(working-age population) x 100
Recommended sources
Labour force surveys and similar large-scale household surveys (e.g. general social surveys) are the preferred source of information for collecting data on volunteer work. Such surveys usually cover virtually the entire non-institutional population of a given country. By attaching special modules to such surveys, participation in a wide range of volunteering activities, both direct and organization-based, can be covered. When the source is a labour force survey, it further provides the opportunity to capture engagement in different forms of work (e.g. employment, volunteer work, own-use production work) to enable joint analysis.
Population censuses also can be used. However, information obtained may be less comprehensive since they do not typically allow for detailed probing on the volunteer activities of the respondents or to capture additional characteristics about the type of volunteer work done. For more details, see the ILO model question on volunteer work for population censuses.
Although widely used to capture volunteer works statistics, time use surveys are the least desirable source of such data. When volunteer work is captured only in a diary, this will not enable to produce information on participation in volunteering or the characteristics of volunteer work. This is because the short reference period (e.g. 24 hours) for diaries only enables to capture time-spent on this activity on a given day in productive activities, which includes volunteering, employment, own-use production work, etc. Nevertheless, time use surveys could be used to measure participation in volunteer work by adding a small set of stylized questions on volunteering in a “4 weeks/one month” reference period in the background questionnaire.
Interpretation and uses
The number of volunteers and the volunteer rate provide information on the engagement in this form of work.
As volunteer work is about helping others, higher volunteer rates can indicate strong social integration and social cohesion in a region or country. It can also signal a situation where certain groups and communities need support to maintain or improve the quality of their lives. From this perspective, the geographical analysis of the indicator, for example, may help identify the areas where significant numbers of people rely on others’ help to avoid poverty and social exclusion.
Joint analysis of the volunteer rate and rates of participation in employment and own-use production work offer a better understanding of how different population groups contribute to a country’s development through paid and unpaid work.
Limitations
Indicators available in the ILOSTAT database are collected from national official reports or produced using published micro-data by national statistical offices. In some cases, published data are used to calculate the number of volunteers (if only the volunteer rate is available) or the volunteer rate (if only the number of volunteers is available) and to calculate indicators for standard age groups (15+, 25-64, 65+). Therefore, totals may not always equal the sum of their components.
Most countries measure participation in both direct and organization-based volunteer work. As one person can do both types of volunteer work, the sum of volunteers by these types will be higher than the total number of volunteers.
Comparability of volunteer work indicators across countries is affected significantly by:
- Differences in the length of reference periods used for measurement (e.g. one week, 4 weeks, 12 months). Typically, for a given population, measurements made using longer reference periods result in higher values. This occurs due to the increased likelihood of capturing the participation of persons who engage in volunteer work less frequently. Very long reference periods (e.g 12 months), however, can also be subject to reporting errors due to recall issues;
- Seasonal variations in data collection periods (ranging from one to 12 months). Participation in volunteer work varies significantly across the year, in relation to natural, economic, cultural and social evolution. As a result, it is difficult to compare indicators referring to a specific month with indicators referring to monthly averages over a quarter or a year;
- Questionnaire design. Measurement approaches vary significantly in relation to the number and type of questions used to identify participation in different types of volunteer work (from 1 to more than 20 questions). More detailed probing can lead to more comprehensive estimates, mainly due to a better detection of engagement in direct volunteer work. Meanwhile, the wording and type of questions used can also impact reporting, and thus, the estimates of volunteer work participation.
- Age coverage. The minimum age varies from 10 to 20 years and some countries set upper age limits. This also limits comparability across countries.
To support data users in making informed conclusions, the database includes detailed notes to describe the main characteristics of the data sources used for measurement. These notes should be consulted when comparing indicators across countries.
Publications
Note: Many publications are available only in English. If available in other languages, a new page will open displaying these options.
Quick guide on the communication of results after implementation of latest standards on statistics of work, employment, and labour underutilization
A crucial aspect of the implementation of latest labour statistics standards is the effective communication of the results, to ensure getting the best out of the data. This guide aims to provide practical data visualization examples to convey clearly and intuitively the impact of methodological changes on key labour indicators following the implementation of the 19th ICLS resolution and avoid misinterpretation of the results.
Survey Questions for Collecting Data on Work Relationships and Informality
This document provides recommended survey questions for collecting data on work relationships (ICSE-18), informal employment, and the classification of economic units across three sectors: informal, formal, and household own-use production and community sector. (HOC). It incorporates the 20th ICLS resolution on work relationships (ICSE-18) and the 21st ICLS resolution on statistics for the informal economy.
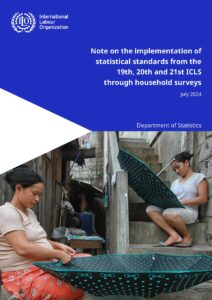
Note on the implementation of statistical standards from the 19th, 20th and 21st ICLS through household surveys
This note provides an overview of the requirements to apply the latest statistical standards through household surveys.
Quick guide to understanding the impact of the new statistical standards on ILOSTAT databases
This quick guide explains the differences between the 13th and 19th ICLS standards, the impact of the revisions on headline indicators, and how the ILO handles this on ILOSTAT.

Resolution concerning statistics of work, employment and labour underutilization (including amendments)
Adopted by the 19th ICLS (2013), this resolution sets standards for work statistics to guide countries in updating and integrating their existing statistical programmes in this field. It defines the statistical concept of work for reference purposes and provides operational concepts, definitions and guidelines for: (a) distinct subsets of work activities, referred to as forms of work; (b) related classifications of the population according to their labour force status and main form of work; (c) measures of labour underutilization.
Indicator catalogue
| Indicator | Frequency | Database | Subject | Download (with labels) | Download (with codes) | Data explorer |
|---|---|---|---|---|---|---|
| Labour force by sex and age -- 19th ICLS (thousands) | Annual | Work Statistics 19th ICLS (WORK) | Labour force | .csv .dta .xlsx | .csv.gz | |
| Labour force by sex and age -- 19th ICLS (thousands) | Quarterly | Work Statistics 19th ICLS (WORK) | Labour force | .csv .dta .xlsx | .csv.gz | |
| Labour force participation rate by sex and age -- 19th ICLS (%) | Annual | Work Statistics 19th ICLS (WORK) | Labour force | .csv .dta .xlsx | .csv.gz | |
| Labour force participation rate by sex and age -- 19th ICLS (%) | Quarterly | Work Statistics 19th ICLS (WORK) | Labour force | .csv .dta .xlsx | .csv.gz | |
| Employment by sex and age -- 19th ICLS (thousands) | Annual | Work Statistics 19th ICLS (WORK) | Employment | .csv .dta .xlsx | .csv.gz | |
| Employment by sex and age -- 19th ICLS (thousands) | Quarterly | Work Statistics 19th ICLS (WORK) | Employment | .csv .dta .xlsx | .csv.gz | |
| Employment by sex and status in employment -- 19th ICLS (thousands) | Annual | Work Statistics 19th ICLS (WORK) | Employment | .csv .dta .xlsx | .csv.gz | |
| Employment by sex and status in employment -- 19th ICLS (thousands) | Quarterly | Work Statistics 19th ICLS (WORK) | Employment | .csv .dta .xlsx | .csv.gz | |
| Employment-to-population ratio by sex and age -- 19th ICLS (%) | Annual | Work Statistics 19th ICLS (WORK) | Employment | .csv .dta .xlsx | .csv.gz | |
| Employment-to-population ratio by sex and age -- 19th ICLS (%) | Quarterly | Work Statistics 19th ICLS (WORK) | Employment | .csv .dta .xlsx | .csv.gz | |
| Informal employment by sex and age -- 19th ICLS (thousands) | Annual | Work Statistics 19th ICLS (WORK) | Informal economy | .csv .dta .xlsx | .csv.gz | |
| Informal employment by sex and age -- 19th ICLS (thousands) | Quarterly | Work Statistics 19th ICLS (WORK) | Informal economy | .csv .dta .xlsx | .csv.gz | |
| Employment outside the formal sector by sex and age -- 19th ICLS (thousands) | Annual | Work Statistics 19th ICLS (WORK) | Informal economy | .csv .dta .xlsx | .csv.gz | |
| Employment outside the formal sector by sex and age -- 19th ICLS (thousands) | Quarterly | Work Statistics 19th ICLS (WORK) | Informal economy | .csv .dta .xlsx | .csv.gz | |
| Informal employment rate by sex and age -- 19th ICLS (%) | Annual | Work Statistics 19th ICLS (WORK) | Informal economy | .csv .dta .xlsx | .csv.gz | |
| Informal employment rate by sex and age -- 19th ICLS (%) | Quarterly | Work Statistics 19th ICLS (WORK) | Informal economy | .csv .dta .xlsx | .csv.gz | |
| Share of employment outside the formal sector by sex and age -- 19th ICLS (%) | Annual | Work Statistics 19th ICLS (WORK) | Informal economy | .csv .dta .xlsx | .csv.gz | |
| Share of employment outside the formal sector by sex and age -- 19th ICLS (%) | Quarterly | Work Statistics 19th ICLS (WORK) | Informal economy | .csv .dta .xlsx | .csv.gz | |
| Time-related underemployment by sex and age -- 19th ICLS (thousands) | Annual | Work Statistics 19th ICLS (WORK) | Time-related underemployment | .csv .dta .xlsx | .csv.gz | |
| Time-related underemployment by sex and age -- 19th ICLS (thousands) | Quarterly | Work Statistics 19th ICLS (WORK) | Time-related underemployment | .csv .dta .xlsx | .csv.gz | |
| Time-related underemployment rate by sex and age -- 19th ICLS (%) | Annual | Work Statistics 19th ICLS (WORK) | Time-related underemployment | .csv .dta .xlsx | .csv.gz | |
| Time-related underemployment rate by sex and age -- 19th ICLS (%) | Quarterly | Work Statistics 19th ICLS (WORK) | Time-related underemployment | .csv .dta .xlsx | .csv.gz | |
| Unemployment by sex and age -- 19th ICLS (thousands) | Annual | Work Statistics 19th ICLS (WORK) | Unemployment | .csv .dta .xlsx | .csv.gz | |
| Unemployment by sex and age -- 19th ICLS (thousands) | Quarterly | Work Statistics 19th ICLS (WORK) | Unemployment | .csv .dta .xlsx | .csv.gz | |
| Unemployment rate by sex and age -- 19th ICLS (%) | Annual | Work Statistics 19th ICLS (WORK) | Unemployment | .csv .dta .xlsx | .csv.gz | |
| Unemployment rate by sex and age -- 19th ICLS (%) | Quarterly | Work Statistics 19th ICLS (WORK) | Unemployment | .csv .dta .xlsx | .csv.gz | |
| Combined rate of time-related underemployment and unemployment (LU2) by sex and age -- 19th ICLS (%) | Annual | Work Statistics 19th ICLS (WORK) | Other measures of labour underutilization | .csv .dta .xlsx | .csv.gz | |
| Combined rate of time-related underemployment and unemployment (LU2) by sex and age -- 19th ICLS (%) | Quarterly | Work Statistics 19th ICLS (WORK) | Other measures of labour underutilization | .csv .dta .xlsx | .csv.gz | |
| Combined rate of unemployment and potential labour force (LU3) by sex and age -- 19th ICLS (%) | Annual | Work Statistics 19th ICLS (WORK) | Other measures of labour underutilization | .csv .dta .xlsx | .csv.gz | |
| Combined rate of unemployment and potential labour force (LU3) by sex and age -- 19th ICLS (%) | Quarterly | Work Statistics 19th ICLS (WORK) | Other measures of labour underutilization | .csv .dta .xlsx | .csv.gz | |
| Composite rate of labour underutilization (LU4) by sex and age -- 19th ICLS (%) | Annual | Work Statistics 19th ICLS (WORK) | Other measures of labour underutilization | .csv .dta .xlsx | .csv.gz | |
| Composite rate of labour underutilization (LU4) by sex and age -- 19th ICLS (%) | Quarterly | Work Statistics 19th ICLS (WORK) | Other measures of labour underutilization | .csv .dta .xlsx | .csv.gz | |
| Potential labour force by sex and age -- 19th ICLS (thousands) | Annual | Work Statistics 19th ICLS (WORK) | Other measures of labour underutilization | .csv .dta .xlsx | .csv.gz | |
| Potential labour force by sex and age -- 19th ICLS (thousands) | Quarterly | Work Statistics 19th ICLS (WORK) | Other measures of labour underutilization | .csv .dta .xlsx | .csv.gz | |
| Persons outside the labour force by sex and age -- 19th ICLS (thousands) | Annual | Work Statistics 19th ICLS (WORK) | Other measures of labour underutilization | .csv .dta .xlsx | .csv.gz | |
| Persons outside the labour force by sex and age -- 19th ICLS (thousands) | Quarterly | Work Statistics 19th ICLS (WORK) | Other measures of labour underutilization | .csv .dta .xlsx | .csv.gz | |
| Inactivity rate by sex and age -- 19th ICLS (%) | Annual | Work Statistics 19th ICLS (WORK) | Other measures of labour underutilization | .csv .dta .xlsx | .csv.gz | |
| Inactivity rate by sex and age -- 19th ICLS (%) | Quarterly | Work Statistics 19th ICLS (WORK) | Other measures of labour underutilization | .csv .dta .xlsx | .csv.gz | |
| Youth not in employment, education or training (NEET) by sex -- 19th ICLS (thousands) | Annual | Work Statistics 19th ICLS (WORK) | Other measures of labour underutilization | .csv .dta .xlsx | .csv.gz | |
| Youth not in employment, education or training (NEET) by sex -- 19th ICLS (thousands) | Quarterly | Work Statistics 19th ICLS (WORK) | Other measures of labour underutilization | .csv .dta .xlsx | .csv.gz | |
| Share of youth not in employment, education or training (NEET) by sex -- 19th ICLS (%) | Annual | Work Statistics 19th ICLS (WORK) | Other measures of labour underutilization | .csv .dta .xlsx | .csv.gz | |
| Share of youth not in employment, education or training (NEET) by sex -- 19th ICLS (%) | Quarterly | Work Statistics 19th ICLS (WORK) | Other measures of labour underutilization | .csv .dta .xlsx | .csv.gz | |
| Number of volunteers by sex and type of volunteer work (thousands) | Annual | Work Statistics 19th ICLS (WORK) | Unpaid work | .csv .dta .xlsx | .csv.gz | |
| Number of volunteers by age and type of volunteer work (thousands) | Annual | Work Statistics 19th ICLS (WORK) | Unpaid work | .csv .dta .xlsx | .csv.gz | |
| Volunteer rate by sex and type of volunteer work (%) | Annual | Work Statistics 19th ICLS (WORK) | Unpaid work | .csv .dta .xlsx | .csv.gz | |
| Volunteer rate by age and type of volunteer work (%) | Annual | Work Statistics 19th ICLS (WORK) | Unpaid work | .csv .dta .xlsx | .csv.gz | |
| Employment by sex and economic activity -- 19th ICLS (thousands) | Annual | Work Statistics 19th ICLS (WORK) | Employment | .csv .dta .xlsx | .csv.gz | |
| Employment by sex and occupation - ISCO level 2 -- 19th ICLS (thousands) | Annual | Work Statistics 19th ICLS (WORK) | Employment | .csv .dta .xlsx | .csv.gz | |
| Employment by sex and occupation -- 19th ICLS (thousands) | Annual | Work Statistics 19th ICLS (WORK) | Employment | .csv .dta .xlsx | .csv.gz | |
| Informal employment rate by sex and economic activity -- 19th ICLS (%) | Annual | Work Statistics 19th ICLS (WORK) | Informal economy | .csv .dta .xlsx | .csv.gz | |
| Unemployment rate by sex and disability status -- 19th ICLS (%) | Annual | Work Statistics 19th ICLS (WORK) | Unemployment | .csv .dta .xlsx | .csv.gz | |
| Employment by sex and economic activity -- 19th ICLS (thousands) | Quarterly | Work Statistics 19th ICLS (WORK) | Employment | .csv .dta .xlsx | .csv.gz | |
| Employment by sex and occupation - ISCO level 2 -- 19th ICLS (thousands) | Quarterly | Work Statistics 19th ICLS (WORK) | Employment | .csv .dta .xlsx | .csv.gz | |
| Employment by sex and occupation -- 19th ICLS (thousands) | Quarterly | Work Statistics 19th ICLS (WORK) | Employment | .csv .dta .xlsx | .csv.gz | |
| Informal employment rate by sex and economic activity -- 19th ICLS (%) | Quarterly | Work Statistics 19th ICLS (WORK) | Informal economy | .csv .dta .xlsx | .csv.gz | |
| Unemployment rate by sex and disability status -- 19th ICLS (%) | Quarterly | Work Statistics 19th ICLS (WORK) | Unemployment | .csv .dta .xlsx | .csv.gz |
