Around the world, women still earn far less than men. But it’s not enough to look only at employees’ earnings. What also matters is total labour income — combining the earnings of employees and the self-employed and accounting for whether people work at all. This blog looks beyond the usual pay gap to explore how employment rates, working time, and pay interact to shape persistent gender inequalities.
Labour income and the labour income gender ratio
Labour income is the income individuals earn from working. It includes their wages, bonuses, and any extra payments from a job. If they are self-employed, it’s the money they make from working, which does not include income from investments, rent, or owning a business without working in it. The inclusion of labour income from self-employment is vital for understanding the status of labour markets globally, as nearly 50 per cent of the global workforce is self-employed, with particularly high shares in low- and lower-middle income countries. Unlike capital income — that is, money earned from assets such as property, patents, or machinery and typically benefitting wealthier individuals — labour income is the main livelihood source for most people. Therefore, examining how labour income is distributed among different groups of the population can help us better understand overall economic disparities.
More specifically, analysing differences in labour income between men and women offers valuable insights into the substantial and persistent gender inequalities in the world of work that we observe today. One simple measure of gender inequalities is the labour income gender ratio. The labour income gender ratio, as illustrated in Figure 1, is the ratio of all the labour income that women collectively earn in a year to the total labour income that men collectively earn over the same period.
This measure has three key advantages:
- It captures inequalities across the full working-age population. By aggregating total labour income – including that of individuals not in employment and hence with zero earnings – it reflects disparities across the entire working-age population, not just among those with a job. In other words, the labour income gender ratio reflects how differences in both the size of the female and male employed population and the earnings of those employed contribute to women receiving less labour income than men over the course of a year.
- It reflects differences in time spent in paid work. Because this ratio uses annual labour income rather than average hourly earnings, it also accounts for differences in the amount of time women and men spend working for pay as an important contributor to gender inequalities.
- It also includes other workplace-related factors. The labour income gender ratio encompasses a range of other factors in the workplace that lead to significant differences in yearly earnings between men and women, including choice of occupation and speed of career progression.
How big are gender inequalities in the world of work?
The labour income earned by all women worldwide amounts to barely over half the money earned by all men. In 2025, the gender ratio in labour income stood at 0.52, meaning that, collectively, women received only 52 cents for every dollar received by men.
Gender inequalities in labour income have narrowed over the past twenty years but remain significant. Between 2004 and 2025, the labour income gender ratio has seen a modest increase, with women going from earning 47 cents on the dollar in 2004 to 52 cents in 2025 (Figure 2). However, this global progress conceals significant regional differences, as seen in Figure 3. In 2025, the ratio of women’s to men’s labour income was only 14 cents in the Arab States, the lowest worldwide, followed by Africa with a ratio of 35 cents. These regions have seen limited progress since 2004. In contrast, Asia and the Pacific, Europe and Central Asia, and the Americas have shown more substantial gains. For example, the ratio in Asia and the Pacific rose from 36 cents in 2004 to 45 cents in 2025, while in the Americas it climbed from 53 to 65 cents during the same period.
Gender gaps in employment and earnings both contribute to lower labour income for women
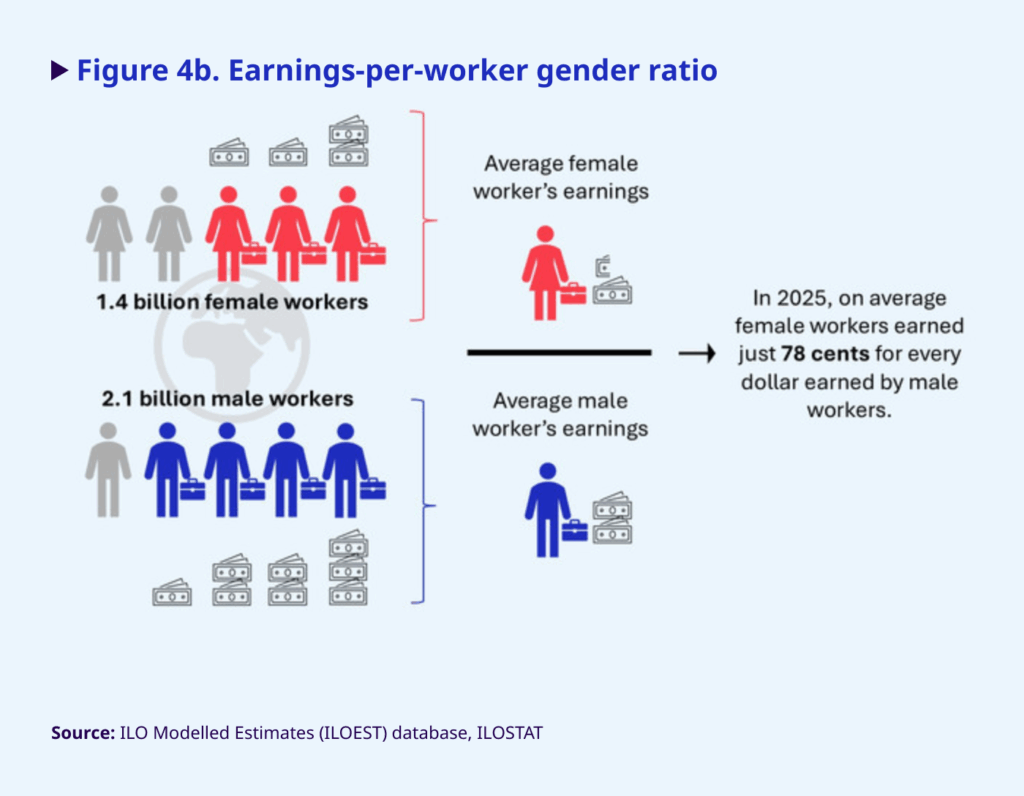
The gender ratio in labour income reflects the combined effect of two key disparities between men and women: differences in employment participation and differences in earnings per worker between men and women. This means that women collectively earned just 52 cents for every dollar earned by men (Figure 4a) for two reasons: (i) fewer women are in employment than men and (ii) the annual average female worker’s earnings are lower than those of men. In 2025, there are 1.4 billion employed women compared to 2.1 billion employed men. In other words, there are roughly 3 male workers for every 2 female workers. Among those who are employed, female workers earn 78 cents for every dollar earned by male workers, as shown in Figure 4b. Both factors – fewer women in the workforce and lower annual earnings – are significant barriers to closing the labour income gender gap.
What drives the earnings disparity between women and men?
Why do female workers earn only 78 cents for every dollar earned by male workers in a year? Annual earnings disparities between female and male workers partly arise from differences in hours worked, job type, and unpaid care responsibilities. One major factor is time: in 2025, women worked an average of 6 hours and 25 minutes less per week in paid employment than men, a gap that has remained largely unchanged since 2005 (see Figure 5). But this statistic only tells part of the story. In all regions of the world, women consistently work longer hours than men when both paid work and unpaid care and domestic work are accounted for. In other words, women not only spend less time on paid work, they also dedicate more time to unpaid care work, which contributes both to their “income poverty” and to their “time poverty” compared to men. Despite making a fundamental contribution to our societies and economies, unpaid care and domestic work is largely unrecognised and undervalued in dominant measures of economic progress such as GDP.
Beyond time constraints, the type of work that women do also limits their earning potential. In the last decade, women have increasingly taken up high-skill roles, leading an overall trend of job upskilling. However, across many sectors and occupations, they remain overrepresented in roles that are typically undervalued, leading to lower pay and less decent working conditions. As of 2023, women hold only 30 per cent of managerial positions globally, highlighting a persistent gap from the desired parity. Nevertheless, this represents a modest improvement of approximately 3.5 percentage points over the past two decades. Notably, low-income countries have demonstrated significant progress, with women’s representation in management rising from 24.7 to 36.5 per cent. In contrast, lower-middle-income countries have experienced a decline in women’s representation in recent years.
Beyond women’s position in management and entrepreneurship, gender segregation across occupations is persistent. Women are overrepresented in occupations related to nursing, childcare and cleaning, with women holding 75 per cent or more of these positions. In contrast, men overwhelmingly dominate in fields such as heavy truck drivers and machinery repairs. While having an equal split of men and women in every occupation might not be realistic or even desired, what truly matters is making sure outdated gender stereotypes do not stand in the way of anyone’s career choices. That means tackling biases from an early age and making sure everyone has equal access to education and job opportunities at all stages of their life.
Another area with significant disparities is the extent of informal employment among women and men. Globally, most workers are engaged in informal employment, often lacking social protection, decent working conditions and collective representation. The informal employment rate in 2025 was higher for men (59 per cent) than for women (56 per cent). However, this gender pattern does not hold across all regions or country income groups. In low-income and lower-middle-income countries, where informality is far more common, women have higher informal employment rates than men by 4.7 and 4.6 percentage points, respectively.
Conclusions
Gender inequalities are complex, with multiple causes and varied manifestations. Labour income data can offer a simple, yet comprehensive snapshot of global gender dynamics in the world of work. From our analysis of gender disparities in labour income, the narrative is clear: progress towards gender parity has been slow and uneven, and achieving true gender equality will require not only bringing more women into employment but also dismantling barriers that limit women’s earning potential. Unpaid care work remains a primary obstacle to accessing quality employment and its economic value must be recognised to prevent an undue burden on women. Persistent gender stereotypes contribute to both vertical and horizontal occupational segregation, while informal employment further restricts women’s access to social protection and decent working conditions in low- and lower-middle income countries. As we strive for a more equitable future, it is vital that policymakers, businesses and communities work together to address all these challenges.
If you want to learn more about broader economic disparities in the world of work, you can explore the labour-income related statistics on ILOSTAT. Published indicators include the labour income share as a percentage of GDP – a key measure of inequality and an SDG indicator – the labour income distribution, and the labour income gender ratio (referred to as “Gender income gap, women’s to men’s labour income” on ILOSTAT). These indicators are part of the ILO modelled estimates collection. Stay tuned for our regular updates.