
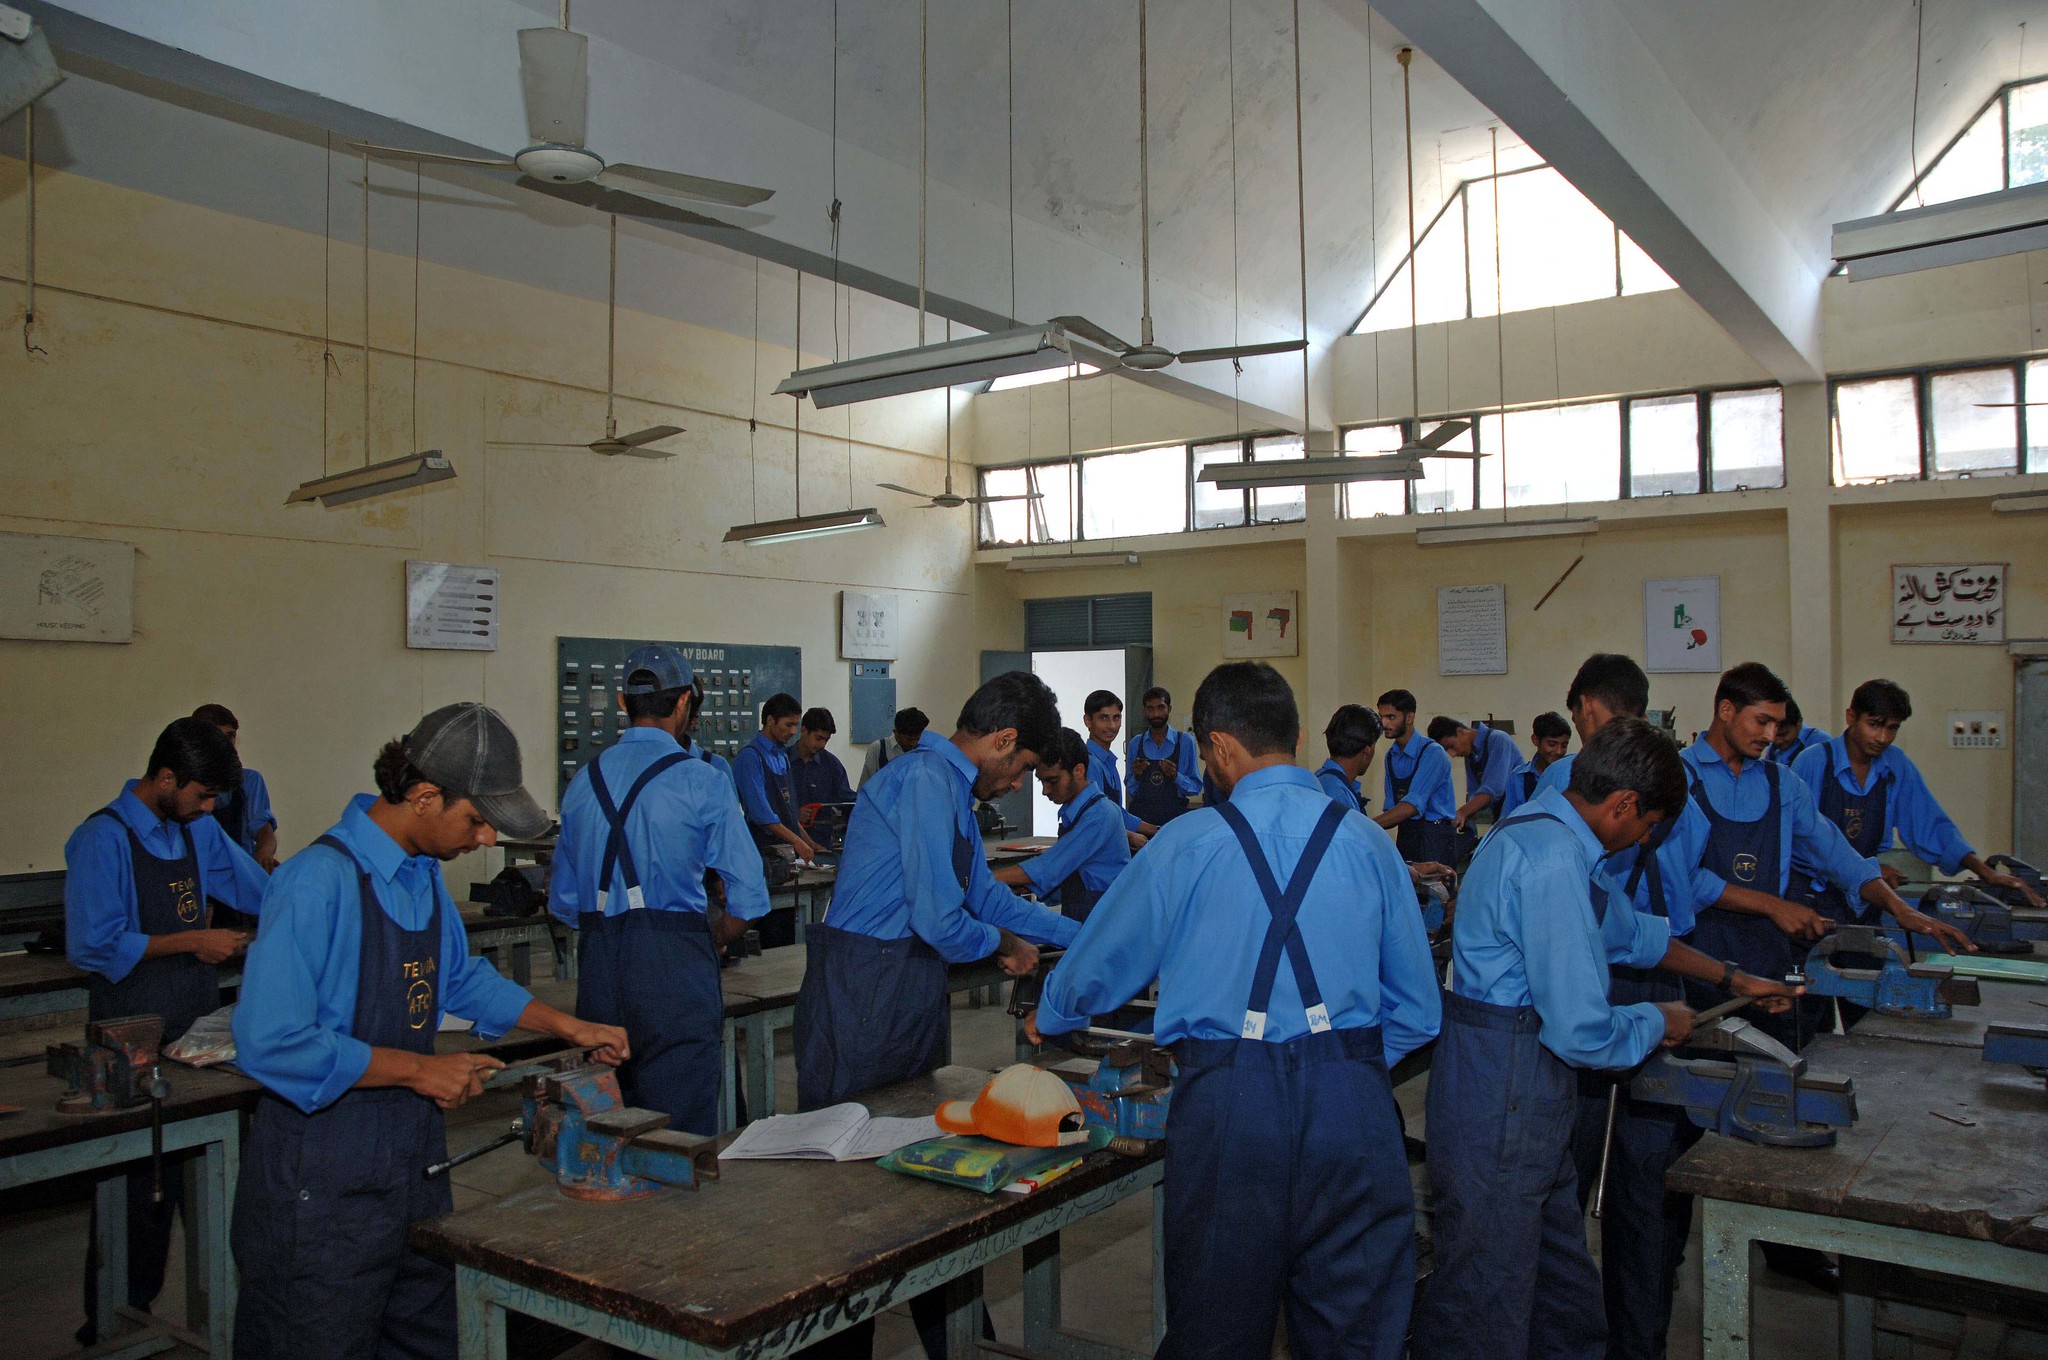
Employment statistics describe the number of persons in employment and the characteristics of their jobs. Most ILOSTAT employment data follow the 13th ICLS standards; employment statistics compiled according to the 19th ICLS (2013) are available in the WORK database.
Data catalogue
|
▸
Employment
229 tables
|
||
| SDG indicator 5.5.2: Proportion of women in senior and middle management positions (%) | Annual |
|
| SDG indicator 5.5.2: Proportion of women in managerial positions (%) | Annual |
|
| SDG indicator 5.5.2: Proportion of women in senior and middle management positions -- 19th ICLS (%) | Annual |
|
| SDG indicator 5.5.2: Proportion of women in managerial positions -- 19th ICLS (%) | Annual |
|
| SDG indicator 8.b.1: Existence of a developed and operationalized national strategy for youth employment | Annual |
|
| SDG indicator 9.2.2: Manufacturing employment as a proportion of total employment (%) | Annual |
|
| SDG indicator 9.2.2: Manufacturing employment as a proportion of total employment -- 19th ICLS (%) | Annual |
|
| Employment by sex and age (thousands) | Annual |
|
| Employment by sex and age (thousands) | Quarterly |
|
| Employment by sex and age (thousands) | Monthly |
|
| Employment by sex, age and education (thousands) | Annual |
|
| Employment by sex, age and education (thousands) | Quarterly |
|
| Employment by sex, age and education (thousands) | Monthly |
|
| Employment by sex, age and rural / urban areas (thousands) | Annual |
|
| Employment by sex, age and rural / urban areas (thousands) | Quarterly |
|
| Employment by sex, age and rural / urban areas (thousands) | Monthly |
|
| Employment by sex, age and marital status (thousands) | Annual |
|
| Employment by sex, age and marital status (thousands) | Quarterly |
|
| Employment by sex, age and disability status (thousands) | Annual |
|
| Employment by sex, age and disability status (thousands) | Quarterly |
|
| Employment by age and status in employment (thousands) | Annual |
|
| Employment by sex, age and status in employment (thousands) | Annual |
|
| Employment by sex, age and status in employment (thousands) | Quarterly |
|
| Employment by sex, age and economic activity (thousands) | Annual |
|
| Employment by sex, age and economic activity (thousands) | Quarterly |
|
| Employment by sex, age and occupation (thousands) | Annual |
|
| Employment by sex, age and occupation (thousands) | Quarterly |
|
| Employment by sex, age and public/private sector (thousands) | Annual |
|
| Employment by sex, age and public/private sector (thousands) | Quarterly |
|
| Employment by sex, age and working time arrangement (thousands) | Annual |
|
| Employment by sex, age and working time arrangement (thousands) | Quarterly |
|
| Employment by sex, age and working time arrangement (thousands) | Monthly |
|
| Employment by sex and education (thousands) | Annual |
|
| Employment by sex and education (thousands) | Quarterly |
|
| Employment by sex and education (thousands) | Monthly |
|
| Employment by sex, education and rural / urban areas (thousands) | Annual |
|
| Employment by sex, education and rural / urban areas (thousands) | Quarterly |
|
| Employment by sex, education and marital status (thousands) | Annual |
|
| Employment by sex, education and marital status (thousands) | Quarterly |
|
| Employment by sex, education and disability status (thousands) | Annual |
|
| Employment by sex and rural / urban areas (thousands) | Annual |
|
| Employment by sex and rural / urban areas (thousands) | Quarterly |
|
| Employment by sex and rural / urban areas (thousands) | Monthly |
|
| Employment by sex, rural / urban area and marital status (thousands) | Annual |
|
| Employment by sex, rural / urban area and marital status (thousands) | Quarterly |
|
| Employment by sex, rural / urban areas and disability status (thousands) | Annual |
|
| Employment by sex, rural / urban areas and disability status (thousands) | Quarterly |
|
| Employment by sex and marital status (thousands) | Annual |
|
| Employment by sex and marital status (thousands) | Quarterly |
|
| Employment by sex and marital status (thousands) | Monthly |
|
| Employment by sex, marital status and disability status (thousands) | Annual |
|
| Employment by sex, marital status and disability status (thousands) | Quarterly |
|
| Employment by sex and disability status (thousands) | Annual |
|
| Employment by sex and disability status (thousands) | Quarterly |
|
| Employment by sex and status in employment (thousands) | Annual |
|
| Employment by sex and status in employment (thousands) | Quarterly |
|
| Employment by sex and status in employment (thousands) | Monthly |
|
| Employment by sex, status in employment and education (thousands) | Annual |
|
| Employment by sex, status in employment and rural / urban areas (thousands) | Annual |
|
| Employment by sex, status in employment and marital status (thousands) | Annual |
|
| Employment by sex, status in employment and marital status (thousands) | Quarterly |
|
| Employment by sex, status in employment and disability status (thousands) | Annual |
|
| Employment by sex, status in employment and economic activity (thousands) | Annual |
|
| Employment by sex, status in employment and economic activity (thousands) | Quarterly |
|
| Employment by sex, status in employment and occupation (thousands) | Annual |
|
| Employment by sex, status in employment and occupation (thousands) | Quarterly |
|
| Employment by sex, status in employment and public/private sector (thousands) | Annual |
|
| Employment by sex, status in employment and public/private sector (thousands) | Quarterly |
|
| Employment by sex, status in employment and establishment size (thousands) | Annual |
|
| Employment by sex, status in employment and establishment size (thousands) | Quarterly |
|
| Employment by sex, status in employment and multiple job holding (thousands) | Annual |
|
| Employment by sex and economic activity (thousands) | Annual |
|
| Employment by sex and economic activity (thousands) | Quarterly |
|
| Employment by sex and economic activity (thousands) | Monthly |
|
| Employment by sex, economic activity and education (thousands) | Annual |
|
| Employment by sex, economic activity and education (thousands) | Quarterly |
|
| Employment by sex, economic activity and rural / urban areas (thousands) | Annual |
|
| Employment by sex, economic activity and marital status (thousands) | Annual |
|
| Employment by sex, economic activity and marital status (thousands) | Quarterly |
|
| Employment by sex, economic activity and disability status (thousands) | Annual |
|
| Employment by economic activity and occupation (thousands) | Annual |
|
| Employment by economic activity and occupation (thousands) | Quarterly |
|
| Employment by sex, economic activity and public/private sector (thousands) | Annual |
|
| Employment by sex, economic activity and public/private sector (thousands) | Quarterly |
|
| Employment by sex, economic activity and public/private sector (thousands) | Monthly |
|
| Employment by sex, economic activity and establishment size (thousands) | Annual |
|
| Employment by sex, economic activity and establishment size (thousands) | Quarterly |
|
| Employment by sex and economic activity - ISIC level 2 (thousands) | Annual |
|
| Employment by sex, economic activity and multiple job holding (thousands) | Annual |
|
| Employment by sex, economic activity and multiple job holding (thousands) | Quarterly |
|
| Employment by age and economic activity - ISIC level 2 (thousands) | Annual |
|
| Employment by sex, education and economic activity - ISIC level 2 (thousands) | Annual |
|
| Employment by sex, status in employment and economic activity - ISIC level 2 (thousands) | Annual |
|
| Employment by sex, occupation and economic activity - ISIC level 2 (thousands) | Annual |
|
| Employment by sex, establishment size and economic activity - ISIC level 2 (thousands) | Annual |
|
| Employment by sex and occupation (thousands) | Annual |
|
| Employment by sex and occupation (thousands) | Quarterly |
|
| Employment by sex and occupation (thousands) | Monthly |
|
| Employment by sex, occupation and education (thousands) | Annual |
|
| Employment by sex, occupation and education (thousands) | Quarterly |
|
| Employment by sex, occupation and rural / urban areas (thousands) | Annual |
|
| Employment by sex, occupation and marital status (thousands) | Annual |
|
| Employment by sex, occupation and marital status (thousands) | Quarterly |
|
| Employment by sex, occupation and disability status (thousands) | Annual |
|
| Employment by sex, occupation and public/private sector (thousands) | Annual |
|
| Employment by sex, occupation and public/private sector (thousands) | Quarterly |
|
| Employment by sex, occupation and establishment size (thousands) | Annual |
|
| Employment by sex, occupation and establishment size (thousands) | Quarterly |
|
| Employment by sex, occupation and multiple job holding (thousands) | Annual |
|
| Employment by sex, occupation and multiple job holding (thousands) | Quarterly |
|
| Employment by sex and occupation - ISCO level 2 (thousands) | Annual |
|
| Employment by sex and generative AI exposure (thousands) | Annual |
|
| Employment by sex and generative AI exposure (thousands) | Quarterly |
|
| Employment by sex and generative AI exposure (thousands) | Monthly |
|
| Employment by age and occupation - ISCO level 2 (thousands) | Annual |
|
| Employment by sex and public/private sector (thousands) | Annual |
|
| Employment by sex and public/private sector (thousands) | Quarterly |
|
| Employment by sex, public/private sector and rural/urban areas (thousands) | Annual |
|
| Employment by sex, public/private sector and rural/urban areas (thousands) | Quarterly |
|
| Employment by sex, public/private sector and marital status (thousands) | Annual |
|
| Employment by sex, public/private sector and marital status (thousands) | Quarterly |
|
| Employment by sex, public/private sector and disability status (thousands) | Annual |
|
| Employment by sex, public/private sector and disability status (thousands) | Quarterly |
|
| Employment by sex and establishment size (thousands) | Annual |
|
| Employment by sex and establishment size (thousands) | Quarterly |
|
| Employment by sex and establishment size (thousands) | Monthly |
|
| Employment by sex, establishment size and rural / urban areas (thousands) | Annual |
|
| Employment by sex, establishment size and rural / urban areas (thousands) | Quarterly |
|
| Employment by sex, establishment size and marital status (thousands) | Annual |
|
| Employment by sex, establishment size and marital status (thousands) | Quarterly |
|
| Employment by sex, establishment size and disability status (thousands) | Annual |
|
| Employment by sex, establishment size and disability status (thousands) | Quarterly |
|
| Employment by sex and weekly hours actually worked (thousands) | Annual |
|
| Employment by sex and weekly hours actually worked (thousands) | Quarterly |
|
| Employment by sex, weekly hours actually worked and education (thousands) | Annual |
|
| Employment by sex, weekly hours actually worked and education (thousands) | Quarterly |
|
| Employment by sex, weekly hours actually worked and rural / urban areas (thousands) | Annual |
|
| Employment by sex, weekly hours actually worked and rural / urban areas (thousands) | Quarterly |
|
| Employment by sex, weekly hours actually worked and marital status (thousands) | Annual |
|
| Employment by sex, weekly hours actually worked and marital status (thousands) | Quarterly |
|
| Employment by sex, weekly hours actually worked and disability status (thousands) | Annual |
|
| Employment by sex, weekly hours actually worked and disability status (thousands) | Quarterly |
|
| Employment by sex and multiple-job holding (thousands) | Annual |
|
| Employment by sex and multiple-job holding (thousands) | Quarterly |
|
| Employment by sex, multiple job holding and rural / urban areas (thousands) | Annual |
|
| Employment by sex, multiple job holding and rural / urban areas (thousands) | Quarterly |
|
| Employment by sex, multiple job holding and education (thousands) | Annual |
|
| Employment by sex, multiple job holding and education (thousands) | Quarterly |
|
| Employment by sex, multiple job holding and marital status (thousands) | Annual |
|
| Employment by sex, multiple job holding and marital status (thousands) | Quarterly |
|
| Employment by sex, multiple job holding and disability status (thousands) | Annual |
|
| Employment by sex, multiple job holding and disability status (thousands) | Quarterly |
|
| Employment, SA by sex and age (thousands) | Quarterly |
|
| Employment, SA by sex and age (thousands) | Monthly |
|
| Employment, SA by sex and economic activity (thousands) | Quarterly |
|
| Employment, SA by sex and economic activity (thousands) | Monthly |
|
| Employment-to-population ratio by sex and age (%) | Annual |
|
| Employment-to-population ratio by sex and age (%) | Quarterly |
|
| Employment-to-population ratio by sex and age (%) | Monthly |
|
| Employment-to-population ratio by sex, age and education (%) | Annual |
|
| Employment-to-population ratio by sex, age and education (%) | Quarterly |
|
| Employment-to-population ratio by sex, age and education (%) | Monthly |
|
| Employment-to-population ratio by sex, age and rural / urban areas (%) | Annual |
|
| Employment-to-population ratio by sex, age and rural / urban areas (%) | Quarterly |
|
| Employment-to-population ratio by sex, age and rural / urban areas (%) | Monthly |
|
| Employment-to-population ratio by sex, age and marital status (%) | Annual |
|
| Employment-to-population ratio by sex, age and marital status (%) | Quarterly |
|
| Employment-to-population ratio by sex, age and disability status (%) | Annual |
|
| Employment-to-population ratio by sex, age and disability status (%) | Quarterly |
|
| Employment-to-population ratio by sex and education (%) | Annual |
|
| Employment-to-population ratio by sex and education (%) | Quarterly |
|
| Employment-to-population ratio by sex and education (%) | Monthly |
|
| Employment-to-population ratio by sex, education and rural / urban areas (%) | Annual |
|
| Employment-to-population ratio by sex, education and rural / urban areas (%) | Quarterly |
|
| Employment-to-population ratio by sex, education and marital status (%) | Annual |
|
| Employment-to-population ratio by sex, education and marital status (%) | Quarterly |
|
| Employment-to-population ratio by sex, education and disability status (%) | Annual |
|
| Employment-to-population ratio by sex and rural / urban areas (%) | Annual |
|
| Employment-to-population ratio by sex and rural / urban areas (%) | Quarterly |
|
| Employment-to-population ratio by sex and rural / urban areas (%) | Monthly |
|
| Employment-to-population ratio by sex, rural / urban area and marital status (%) | Annual |
|
| Employment-to-population ratio by sex, rural / urban area and marital status (%) | Quarterly |
|
| Employment-to-population ratio by sex, rural / urban areas and disability status (%) | Annual |
|
| Employment-to-population ratio by sex, rural / urban areas and disability status (%) | Quarterly |
|
| Employment-to-population ratio by sex and marital status (%) | Annual |
|
| Employment-to-population ratio by sex and marital status (%) | Quarterly |
|
| Employment-to-population ratio by sex and marital status (%) | Monthly |
|
| Employment-to-population ratio by sex, marital status and disability status (%) | Annual |
|
| Employment-to-population ratio by sex, marital status and disability status (%) | Quarterly |
|
| Employment-to-population ratio by sex and disability status (%) | Annual |
|
| Employment-to-population ratio by sex and disability status (%) | Quarterly |
|
| Prime-age employment-to-population ratio by sex, household type and presence of children (%) | Annual |
|
| Prime-age employment-to-population ratio by sex, household type and rural / urban areas (%) | Annual |
|
| Employment-to-population ratio, SA by sex and age (%) | Quarterly |
|
| Employment-to-population ratio, SA by sex and age (%) | Monthly |
|
| Incidence of part-time employment by sex (%) | Annual |
|
| Youth employment by sex, age and education (thousands) | Annual |
|
| Youth employment by sex, age and rural / urban areas (thousands) | Annual |
|
| Youth employment by sex, age and disability status (thousands) | Annual |
|
| Youth employment by sex, age and school attendance status (thousands) | Annual |
|
| Youth employment by sex, age and status in employment (thousands) | Annual |
|
| Youth employment by sex, age and economic activity (thousands) | Annual |
|
| Youth employment by sex, age and occupation (thousands) | Annual |
|
| Youth employment by sex, age and generative AI exposure (thousands) | Annual |
|
| Youth employment by sex, age and weekly hours actually worked (thousands) | Annual |
|
| Youth employment by sex, age and working time arrangement (thousands) | Annual |
|
| Youth employment-to-population ratio by sex, age and disability status (%) | Annual |
|
| Youth employment-to-population ratio by sex, age and education (%) | Annual |
|
| Youth employment-to-population ratio by sex, age and rural / urban areas (%) | Annual |
|
| Youth employment-to-population ratio by sex, age and school attendance status (%) | Annual |
|
| Employment by sex and age -- ILO modelled estimates, Nov. 2025 (thousands) | Annual |
|
| Employment by sex and status in employment -- ILO modelled estimates, Nov. 2025 (thousands) | Annual |
|
| Employment by age and status in employment -- ILO modelled estimates, Nov. 2025 (thousands) | Annual |
|
| Employment by sex and economic activity -- ILO modelled estimates, Nov. 2025 (thousands) | Annual |
|
| Employment by sex and occupation -- ILO modelled estimates, Nov. 2025 (thousands) | Annual |
|
| Employment-to-population ratio by sex and age -- ILO modelled estimates, Nov. 2025 (%) | Annual |
|
| Full-time equivalent employment by sex -- ILO modelled estimates, Nov. 2025 (thousands) | Annual |
|
| Employment by sex and age -- 19th ICLS (thousands) | Annual |
|
| Employment by sex and age -- 19th ICLS (thousands) | Quarterly |
|
| Employment by sex and status in employment -- 19th ICLS (thousands) | Annual |
|
| Employment by sex and status in employment -- 19th ICLS (thousands) | Quarterly |
|
| Employment by sex and economic activity -- 19th ICLS (thousands) | Annual |
|
| Employment by sex and economic activity -- 19th ICLS (thousands) | Quarterly |
|
| Employment by sex and occupation -- 19th ICLS (thousands) | Annual |
|
| Employment by sex and occupation -- 19th ICLS (thousands) | Quarterly |
|
| Employment by sex and occupation - ISCO level 2 -- 19th ICLS (thousands) | Annual |
|
| Employment by sex and occupation - ISCO level 2 -- 19th ICLS (thousands) | Quarterly |
|
| Employment-to-population ratio by sex and age -- 19th ICLS (%) | Annual |
|
| Employment-to-population ratio by sex and age -- 19th ICLS (%) | Quarterly |
|
|
▸
SDG Labour Market Indicators (ILOSDG)
7 tables
|
||
| SDG indicator 5.5.2: Proportion of women in senior and middle management positions (%) | Annual |
|
| SDG indicator 5.5.2: Proportion of women in managerial positions (%) | Annual |
|
| SDG indicator 5.5.2: Proportion of women in senior and middle management positions -- 19th ICLS (%) | Annual |
|
| SDG indicator 5.5.2: Proportion of women in managerial positions -- 19th ICLS (%) | Annual |
|
| SDG indicator 8.b.1: Existence of a developed and operationalized national strategy for youth employment | Annual |
|
| SDG indicator 9.2.2: Manufacturing employment as a proportion of total employment (%) | Annual |
|
| SDG indicator 9.2.2: Manufacturing employment as a proportion of total employment -- 19th ICLS (%) | Annual |
|
|
▸
Labour Force Statistics (LFS)
71 tables
|
||
| Employment by sex and age (thousands) | Annual |
|
| Employment by sex and age (thousands) | Quarterly |
|
| Employment by sex and age (thousands) | Monthly |
|
| Employment by age and status in employment (thousands) | Annual |
|
| Employment by sex, age and status in employment (thousands) | Annual |
|
| Employment by sex, age and status in employment (thousands) | Quarterly |
|
| Employment by sex, age and economic activity (thousands) | Annual |
|
| Employment by sex, age and economic activity (thousands) | Quarterly |
|
| Employment by sex, age and occupation (thousands) | Annual |
|
| Employment by sex, age and occupation (thousands) | Quarterly |
|
| Employment by sex, age and public/private sector (thousands) | Annual |
|
| Employment by sex, age and public/private sector (thousands) | Quarterly |
|
| Employment by sex and status in employment (thousands) | Annual |
|
| Employment by sex and status in employment (thousands) | Quarterly |
|
| Employment by sex and status in employment (thousands) | Monthly |
|
| Employment by sex, status in employment and economic activity (thousands) | Annual |
|
| Employment by sex, status in employment and economic activity (thousands) | Quarterly |
|
| Employment by sex, status in employment and occupation (thousands) | Annual |
|
| Employment by sex, status in employment and occupation (thousands) | Quarterly |
|
| Employment by sex, status in employment and public/private sector (thousands) | Annual |
|
| Employment by sex, status in employment and public/private sector (thousands) | Quarterly |
|
| Employment by sex, status in employment and establishment size (thousands) | Annual |
|
| Employment by sex, status in employment and establishment size (thousands) | Quarterly |
|
| Employment by sex, status in employment and multiple job holding (thousands) | Annual |
|
| Employment by sex and economic activity (thousands) | Annual |
|
| Employment by sex and economic activity (thousands) | Quarterly |
|
| Employment by sex and economic activity (thousands) | Monthly |
|
| Employment by economic activity and occupation (thousands) | Annual |
|
| Employment by economic activity and occupation (thousands) | Quarterly |
|
| Employment by sex, economic activity and public/private sector (thousands) | Annual |
|
| Employment by sex, economic activity and public/private sector (thousands) | Quarterly |
|
| Employment by sex, economic activity and public/private sector (thousands) | Monthly |
|
| Employment by sex, economic activity and establishment size (thousands) | Annual |
|
| Employment by sex, economic activity and establishment size (thousands) | Quarterly |
|
| Employment by sex and economic activity - ISIC level 2 (thousands) | Annual |
|
| Employment by sex, economic activity and multiple job holding (thousands) | Annual |
|
| Employment by sex, economic activity and multiple job holding (thousands) | Quarterly |
|
| Employment by age and economic activity - ISIC level 2 (thousands) | Annual |
|
| Employment by sex, status in employment and economic activity - ISIC level 2 (thousands) | Annual |
|
| Employment by sex, occupation and economic activity - ISIC level 2 (thousands) | Annual |
|
| Employment by sex, establishment size and economic activity - ISIC level 2 (thousands) | Annual |
|
| Employment by sex and occupation (thousands) | Annual |
|
| Employment by sex and occupation (thousands) | Quarterly |
|
| Employment by sex and occupation (thousands) | Monthly |
|
| Employment by sex, occupation and public/private sector (thousands) | Annual |
|
| Employment by sex, occupation and public/private sector (thousands) | Quarterly |
|
| Employment by sex, occupation and establishment size (thousands) | Annual |
|
| Employment by sex, occupation and establishment size (thousands) | Quarterly |
|
| Employment by sex, occupation and multiple job holding (thousands) | Annual |
|
| Employment by sex, occupation and multiple job holding (thousands) | Quarterly |
|
| Employment by sex and occupation - ISCO level 2 (thousands) | Annual |
|
| Employment by sex and generative AI exposure (thousands) | Annual |
|
| Employment by sex and generative AI exposure (thousands) | Quarterly |
|
| Employment by sex and generative AI exposure (thousands) | Monthly |
|
| Employment by age and occupation - ISCO level 2 (thousands) | Annual |
|
| Employment by sex and public/private sector (thousands) | Annual |
|
| Employment by sex and public/private sector (thousands) | Quarterly |
|
| Employment by sex and establishment size (thousands) | Annual |
|
| Employment by sex and establishment size (thousands) | Quarterly |
|
| Employment by sex and establishment size (thousands) | Monthly |
|
| Employment by sex and multiple-job holding (thousands) | Annual |
|
| Employment by sex and multiple-job holding (thousands) | Quarterly |
|
| Employment, SA by sex and age (thousands) | Quarterly |
|
| Employment, SA by sex and age (thousands) | Monthly |
|
| Employment, SA by sex and economic activity (thousands) | Quarterly |
|
| Employment, SA by sex and economic activity (thousands) | Monthly |
|
| Employment-to-population ratio by sex and age (%) | Annual |
|
| Employment-to-population ratio by sex and age (%) | Quarterly |
|
| Employment-to-population ratio by sex and age (%) | Monthly |
|
| Employment-to-population ratio, SA by sex and age (%) | Quarterly |
|
| Employment-to-population ratio, SA by sex and age (%) | Monthly |
|
|
▸
ILO Modelled Estimates (ILOEST)
7 tables
|
||
| Employment by sex and age -- ILO modelled estimates, Nov. 2025 (thousands) | Annual |
|
| Employment by sex and status in employment -- ILO modelled estimates, Nov. 2025 (thousands) | Annual |
|
| Employment by age and status in employment -- ILO modelled estimates, Nov. 2025 (thousands) | Annual |
|
| Employment by sex and economic activity -- ILO modelled estimates, Nov. 2025 (thousands) | Annual |
|
| Employment by sex and occupation -- ILO modelled estimates, Nov. 2025 (thousands) | Annual |
|
| Employment-to-population ratio by sex and age -- ILO modelled estimates, Nov. 2025 (%) | Annual |
|
| Full-time equivalent employment by sex -- ILO modelled estimates, Nov. 2025 (thousands) | Annual |
|
|
▸
Work Statistics -- 19th ICLS (WORK)
12 tables
|
||
| Employment by sex and age -- 19th ICLS (thousands) | Annual |
|
| Employment by sex and age -- 19th ICLS (thousands) | Quarterly |
|
| Employment by sex and status in employment -- 19th ICLS (thousands) | Annual |
|
| Employment by sex and status in employment -- 19th ICLS (thousands) | Quarterly |
|
| Employment by sex and economic activity -- 19th ICLS (thousands) | Annual |
|
| Employment by sex and economic activity -- 19th ICLS (thousands) | Quarterly |
|
| Employment by sex and occupation -- 19th ICLS (thousands) | Annual |
|
| Employment by sex and occupation -- 19th ICLS (thousands) | Quarterly |
|
| Employment by sex and occupation - ISCO level 2 -- 19th ICLS (thousands) | Annual |
|
| Employment by sex and occupation - ISCO level 2 -- 19th ICLS (thousands) | Quarterly |
|
| Employment-to-population ratio by sex and age -- 19th ICLS (%) | Annual |
|
| Employment-to-population ratio by sex and age -- 19th ICLS (%) | Quarterly |
|
|
▸
Wages and Working Time Statistics (COND)
6 tables
|
||
| Employment by sex, age and working time arrangement (thousands) | Annual |
|
| Employment by sex, age and working time arrangement (thousands) | Quarterly |
|
| Employment by sex, age and working time arrangement (thousands) | Monthly |
|
| Employment by sex and weekly hours actually worked (thousands) | Annual |
|
| Employment by sex and weekly hours actually worked (thousands) | Quarterly |
|
| Incidence of part-time employment by sex (%) | Annual |
|
|
▸
Youth Labour Market Indicators (YouthSTATS)
14 tables
|
||
| Youth employment by sex, age and education (thousands) | Annual |
|
| Youth employment by sex, age and rural / urban areas (thousands) | Annual |
|
| Youth employment by sex, age and disability status (thousands) | Annual |
|
| Youth employment by sex, age and school attendance status (thousands) | Annual |
|
| Youth employment by sex, age and status in employment (thousands) | Annual |
|
| Youth employment by sex, age and economic activity (thousands) | Annual |
|
| Youth employment by sex, age and occupation (thousands) | Annual |
|
| Youth employment by sex, age and generative AI exposure (thousands) | Annual |
|
| Youth employment by sex, age and weekly hours actually worked (thousands) | Annual |
|
| Youth employment by sex, age and working time arrangement (thousands) | Annual |
|
| Youth employment-to-population ratio by sex, age and disability status (%) | Annual |
|
| Youth employment-to-population ratio by sex, age and education (%) | Annual |
|
| Youth employment-to-population ratio by sex, age and rural / urban areas (%) | Annual |
|
| Youth employment-to-population ratio by sex, age and school attendance status (%) | Annual |
|
|
▸
Gender Equality and Non-Discrimination Indicators (GEND)
26 tables
|
||
| Employment by sex, age and marital status (thousands) | Annual |
|
| Employment by sex, age and marital status (thousands) | Quarterly |
|
| Employment by sex and marital status (thousands) | Annual |
|
| Employment by sex and marital status (thousands) | Quarterly |
|
| Employment by sex and marital status (thousands) | Monthly |
|
| Employment by sex, status in employment and marital status (thousands) | Annual |
|
| Employment by sex, status in employment and marital status (thousands) | Quarterly |
|
| Employment by sex, economic activity and marital status (thousands) | Annual |
|
| Employment by sex, economic activity and marital status (thousands) | Quarterly |
|
| Employment by sex, occupation and marital status (thousands) | Annual |
|
| Employment by sex, occupation and marital status (thousands) | Quarterly |
|
| Employment by sex, public/private sector and marital status (thousands) | Annual |
|
| Employment by sex, public/private sector and marital status (thousands) | Quarterly |
|
| Employment by sex, establishment size and marital status (thousands) | Annual |
|
| Employment by sex, establishment size and marital status (thousands) | Quarterly |
|
| Employment by sex, weekly hours actually worked and marital status (thousands) | Annual |
|
| Employment by sex, weekly hours actually worked and marital status (thousands) | Quarterly |
|
| Employment by sex, multiple job holding and marital status (thousands) | Annual |
|
| Employment by sex, multiple job holding and marital status (thousands) | Quarterly |
|
| Employment-to-population ratio by sex, age and marital status (%) | Annual |
|
| Employment-to-population ratio by sex, age and marital status (%) | Quarterly |
|
| Employment-to-population ratio by sex and marital status (%) | Annual |
|
| Employment-to-population ratio by sex and marital status (%) | Quarterly |
|
| Employment-to-population ratio by sex and marital status (%) | Monthly |
|
| Prime-age employment-to-population ratio by sex, household type and presence of children (%) | Annual |
|
| Prime-age employment-to-population ratio by sex, household type and rural / urban areas (%) | Annual |
|
|
▸
Disability Labour Market Indicators (DLMI)
29 tables
|
||
| Employment by sex, age and disability status (thousands) | Annual |
|
| Employment by sex, age and disability status (thousands) | Quarterly |
|
| Employment by sex, education and disability status (thousands) | Annual |
|
| Employment by sex, rural / urban areas and disability status (thousands) | Annual |
|
| Employment by sex, rural / urban areas and disability status (thousands) | Quarterly |
|
| Employment by sex, marital status and disability status (thousands) | Annual |
|
| Employment by sex, marital status and disability status (thousands) | Quarterly |
|
| Employment by sex and disability status (thousands) | Annual |
|
| Employment by sex and disability status (thousands) | Quarterly |
|
| Employment by sex, status in employment and disability status (thousands) | Annual |
|
| Employment by sex, economic activity and disability status (thousands) | Annual |
|
| Employment by sex, occupation and disability status (thousands) | Annual |
|
| Employment by sex, public/private sector and disability status (thousands) | Annual |
|
| Employment by sex, public/private sector and disability status (thousands) | Quarterly |
|
| Employment by sex, establishment size and disability status (thousands) | Annual |
|
| Employment by sex, establishment size and disability status (thousands) | Quarterly |
|
| Employment by sex, weekly hours actually worked and disability status (thousands) | Annual |
|
| Employment by sex, weekly hours actually worked and disability status (thousands) | Quarterly |
|
| Employment by sex, multiple job holding and disability status (thousands) | Annual |
|
| Employment by sex, multiple job holding and disability status (thousands) | Quarterly |
|
| Employment-to-population ratio by sex, age and disability status (%) | Annual |
|
| Employment-to-population ratio by sex, age and disability status (%) | Quarterly |
|
| Employment-to-population ratio by sex, education and disability status (%) | Annual |
|
| Employment-to-population ratio by sex, rural / urban areas and disability status (%) | Annual |
|
| Employment-to-population ratio by sex, rural / urban areas and disability status (%) | Quarterly |
|
| Employment-to-population ratio by sex, marital status and disability status (%) | Annual |
|
| Employment-to-population ratio by sex, marital status and disability status (%) | Quarterly |
|
| Employment-to-population ratio by sex and disability status (%) | Annual |
|
| Employment-to-population ratio by sex and disability status (%) | Quarterly |
|
|
▸
Rural and Urban Labour Markets (RURBAN)
27 tables
|
||
| Employment by sex, age and rural / urban areas (thousands) | Annual |
|
| Employment by sex, age and rural / urban areas (thousands) | Quarterly |
|
| Employment by sex, age and rural / urban areas (thousands) | Monthly |
|
| Employment by sex and rural / urban areas (thousands) | Annual |
|
| Employment by sex and rural / urban areas (thousands) | Quarterly |
|
| Employment by sex and rural / urban areas (thousands) | Monthly |
|
| Employment by sex, rural / urban area and marital status (thousands) | Annual |
|
| Employment by sex, rural / urban area and marital status (thousands) | Quarterly |
|
| Employment by sex, status in employment and rural / urban areas (thousands) | Annual |
|
| Employment by sex, economic activity and rural / urban areas (thousands) | Annual |
|
| Employment by sex, occupation and rural / urban areas (thousands) | Annual |
|
| Employment by sex, public/private sector and rural/urban areas (thousands) | Annual |
|
| Employment by sex, public/private sector and rural/urban areas (thousands) | Quarterly |
|
| Employment by sex, establishment size and rural / urban areas (thousands) | Annual |
|
| Employment by sex, establishment size and rural / urban areas (thousands) | Quarterly |
|
| Employment by sex, weekly hours actually worked and rural / urban areas (thousands) | Annual |
|
| Employment by sex, weekly hours actually worked and rural / urban areas (thousands) | Quarterly |
|
| Employment by sex, multiple job holding and rural / urban areas (thousands) | Annual |
|
| Employment by sex, multiple job holding and rural / urban areas (thousands) | Quarterly |
|
| Employment-to-population ratio by sex, age and rural / urban areas (%) | Annual |
|
| Employment-to-population ratio by sex, age and rural / urban areas (%) | Quarterly |
|
| Employment-to-population ratio by sex, age and rural / urban areas (%) | Monthly |
|
| Employment-to-population ratio by sex and rural / urban areas (%) | Annual |
|
| Employment-to-population ratio by sex and rural / urban areas (%) | Quarterly |
|
| Employment-to-population ratio by sex and rural / urban areas (%) | Monthly |
|
| Employment-to-population ratio by sex, rural / urban area and marital status (%) | Annual |
|
| Employment-to-population ratio by sex, rural / urban area and marital status (%) | Quarterly |
|
|
▸
Education and Mismatch Indicators (EMI)
30 tables
|
||
| Employment by sex, age and education (thousands) | Annual |
|
| Employment by sex, age and education (thousands) | Quarterly |
|
| Employment by sex, age and education (thousands) | Monthly |
|
| Employment by sex and education (thousands) | Annual |
|
| Employment by sex and education (thousands) | Quarterly |
|
| Employment by sex and education (thousands) | Monthly |
|
| Employment by sex, education and rural / urban areas (thousands) | Annual |
|
| Employment by sex, education and rural / urban areas (thousands) | Quarterly |
|
| Employment by sex, education and marital status (thousands) | Annual |
|
| Employment by sex, education and marital status (thousands) | Quarterly |
|
| Employment by sex, status in employment and education (thousands) | Annual |
|
| Employment by sex, economic activity and education (thousands) | Annual |
|
| Employment by sex, economic activity and education (thousands) | Quarterly |
|
| Employment by sex, education and economic activity - ISIC level 2 (thousands) | Annual |
|
| Employment by sex, occupation and education (thousands) | Annual |
|
| Employment by sex, occupation and education (thousands) | Quarterly |
|
| Employment by sex, weekly hours actually worked and education (thousands) | Annual |
|
| Employment by sex, weekly hours actually worked and education (thousands) | Quarterly |
|
| Employment by sex, multiple job holding and education (thousands) | Annual |
|
| Employment by sex, multiple job holding and education (thousands) | Quarterly |
|
| Employment-to-population ratio by sex, age and education (%) | Annual |
|
| Employment-to-population ratio by sex, age and education (%) | Quarterly |
|
| Employment-to-population ratio by sex, age and education (%) | Monthly |
|
| Employment-to-population ratio by sex and education (%) | Annual |
|
| Employment-to-population ratio by sex and education (%) | Quarterly |
|
| Employment-to-population ratio by sex and education (%) | Monthly |
|
| Employment-to-population ratio by sex, education and rural / urban areas (%) | Annual |
|
| Employment-to-population ratio by sex, education and rural / urban areas (%) | Quarterly |
|
| Employment-to-population ratio by sex, education and marital status (%) | Annual |
|
| Employment-to-population ratio by sex, education and marital status (%) | Quarterly |
|
|
▸
SDG indicator 5.5.2: Proportion of women in senior and middle management positions
2 tables
|
||
| SDG indicator 5.5.2: Proportion of women in senior and middle management positions (%) | Annual |
|
| SDG indicator 5.5.2: Proportion of women in senior and middle management positions -- 19th ICLS (%) | Annual |
|
|
▸
SDG indicator 5.5.2: Proportion of women in managerial positions
2 tables
|
||
| SDG indicator 5.5.2: Proportion of women in managerial positions (%) | Annual |
|
| SDG indicator 5.5.2: Proportion of women in managerial positions -- 19th ICLS (%) | Annual |
|
|
▸
SDG indicator 8.b.1: Existence of a developed and operationalized national strategy for youth employment
1 table
|
||
| SDG indicator 8.b.1: Existence of a developed and operationalized national strategy for youth employment | Annual |
|
|
▸
SDG indicator 9.2.2: Manufacturing employment as a proportion of total employment
2 tables
|
||
| SDG indicator 9.2.2: Manufacturing employment as a proportion of total employment (%) | Annual |
|
| SDG indicator 9.2.2: Manufacturing employment as a proportion of total employment -- 19th ICLS (%) | Annual |
|
|
▸
Employment (previous ILO definition)
145 tables
|
||
| Employment by sex and age (thousands) | Annual |
|
| Employment by sex and age (thousands) | Quarterly |
|
| Employment by sex and age (thousands) | Monthly |
|
| Employment by sex, age and education (thousands) | Annual |
|
| Employment by sex, age and education (thousands) | Quarterly |
|
| Employment by sex, age and education (thousands) | Monthly |
|
| Employment by sex, age and rural / urban areas (thousands) | Annual |
|
| Employment by sex, age and rural / urban areas (thousands) | Quarterly |
|
| Employment by sex, age and rural / urban areas (thousands) | Monthly |
|
| Employment by sex, age and marital status (thousands) | Annual |
|
| Employment by sex, age and marital status (thousands) | Quarterly |
|
| Employment by sex, age and disability status (thousands) | Annual |
|
| Employment by sex, age and disability status (thousands) | Quarterly |
|
| Employment by age and status in employment (thousands) | Annual |
|
| Employment by sex, age and status in employment (thousands) | Annual |
|
| Employment by sex, age and status in employment (thousands) | Quarterly |
|
| Employment by sex, age and economic activity (thousands) | Annual |
|
| Employment by sex, age and economic activity (thousands) | Quarterly |
|
| Employment by sex, age and occupation (thousands) | Annual |
|
| Employment by sex, age and occupation (thousands) | Quarterly |
|
| Employment by sex, age and public/private sector (thousands) | Annual |
|
| Employment by sex, age and public/private sector (thousands) | Quarterly |
|
| Employment by sex, age and working time arrangement (thousands) | Annual |
|
| Employment by sex, age and working time arrangement (thousands) | Quarterly |
|
| Employment by sex, age and working time arrangement (thousands) | Monthly |
|
| Employment by sex and education (thousands) | Annual |
|
| Employment by sex and education (thousands) | Quarterly |
|
| Employment by sex and education (thousands) | Monthly |
|
| Employment by sex, education and rural / urban areas (thousands) | Annual |
|
| Employment by sex, education and rural / urban areas (thousands) | Quarterly |
|
| Employment by sex, education and marital status (thousands) | Annual |
|
| Employment by sex, education and marital status (thousands) | Quarterly |
|
| Employment by sex, education and disability status (thousands) | Annual |
|
| Employment by sex and rural / urban areas (thousands) | Annual |
|
| Employment by sex and rural / urban areas (thousands) | Quarterly |
|
| Employment by sex and rural / urban areas (thousands) | Monthly |
|
| Employment by sex, rural / urban area and marital status (thousands) | Annual |
|
| Employment by sex, rural / urban area and marital status (thousands) | Quarterly |
|
| Employment by sex, rural / urban areas and disability status (thousands) | Annual |
|
| Employment by sex, rural / urban areas and disability status (thousands) | Quarterly |
|
| Employment by sex and marital status (thousands) | Annual |
|
| Employment by sex and marital status (thousands) | Quarterly |
|
| Employment by sex and marital status (thousands) | Monthly |
|
| Employment by sex, marital status and disability status (thousands) | Annual |
|
| Employment by sex, marital status and disability status (thousands) | Quarterly |
|
| Employment by sex and disability status (thousands) | Annual |
|
| Employment by sex and disability status (thousands) | Quarterly |
|
| Employment by sex and status in employment (thousands) | Annual |
|
| Employment by sex and status in employment (thousands) | Quarterly |
|
| Employment by sex and status in employment (thousands) | Monthly |
|
| Employment by sex, status in employment and education (thousands) | Annual |
|
| Employment by sex, status in employment and rural / urban areas (thousands) | Annual |
|
| Employment by sex, status in employment and marital status (thousands) | Annual |
|
| Employment by sex, status in employment and marital status (thousands) | Quarterly |
|
| Employment by sex, status in employment and disability status (thousands) | Annual |
|
| Employment by sex, status in employment and economic activity (thousands) | Annual |
|
| Employment by sex, status in employment and economic activity (thousands) | Quarterly |
|
| Employment by sex, status in employment and occupation (thousands) | Annual |
|
| Employment by sex, status in employment and occupation (thousands) | Quarterly |
|
| Employment by sex, status in employment and public/private sector (thousands) | Annual |
|
| Employment by sex, status in employment and public/private sector (thousands) | Quarterly |
|
| Employment by sex, status in employment and establishment size (thousands) | Annual |
|
| Employment by sex, status in employment and establishment size (thousands) | Quarterly |
|
| Employment by sex, status in employment and multiple job holding (thousands) | Annual |
|
| Employment by sex and economic activity (thousands) | Annual |
|
| Employment by sex and economic activity (thousands) | Quarterly |
|
| Employment by sex and economic activity (thousands) | Monthly |
|
| Employment by sex, economic activity and education (thousands) | Annual |
|
| Employment by sex, economic activity and education (thousands) | Quarterly |
|
| Employment by sex, economic activity and rural / urban areas (thousands) | Annual |
|
| Employment by sex, economic activity and marital status (thousands) | Annual |
|
| Employment by sex, economic activity and marital status (thousands) | Quarterly |
|
| Employment by sex, economic activity and disability status (thousands) | Annual |
|
| Employment by economic activity and occupation (thousands) | Annual |
|
| Employment by economic activity and occupation (thousands) | Quarterly |
|
| Employment by sex, economic activity and public/private sector (thousands) | Annual |
|
| Employment by sex, economic activity and public/private sector (thousands) | Quarterly |
|
| Employment by sex, economic activity and public/private sector (thousands) | Monthly |
|
| Employment by sex, economic activity and establishment size (thousands) | Annual |
|
| Employment by sex, economic activity and establishment size (thousands) | Quarterly |
|
| Employment by sex and economic activity - ISIC level 2 (thousands) | Annual |
|
| Employment by sex, economic activity and multiple job holding (thousands) | Annual |
|
| Employment by sex, economic activity and multiple job holding (thousands) | Quarterly |
|
| Employment by age and economic activity - ISIC level 2 (thousands) | Annual |
|
| Employment by sex, education and economic activity - ISIC level 2 (thousands) | Annual |
|
| Employment by sex, status in employment and economic activity - ISIC level 2 (thousands) | Annual |
|
| Employment by sex, occupation and economic activity - ISIC level 2 (thousands) | Annual |
|
| Employment by sex, establishment size and economic activity - ISIC level 2 (thousands) | Annual |
|
| Employment by sex and occupation (thousands) | Annual |
|
| Employment by sex and occupation (thousands) | Quarterly |
|
| Employment by sex and occupation (thousands) | Monthly |
|
| Employment by sex, occupation and education (thousands) | Annual |
|
| Employment by sex, occupation and education (thousands) | Quarterly |
|
| Employment by sex, occupation and rural / urban areas (thousands) | Annual |
|
| Employment by sex, occupation and marital status (thousands) | Annual |
|
| Employment by sex, occupation and marital status (thousands) | Quarterly |
|
| Employment by sex, occupation and disability status (thousands) | Annual |
|
| Employment by sex, occupation and public/private sector (thousands) | Annual |
|
| Employment by sex, occupation and public/private sector (thousands) | Quarterly |
|
| Employment by sex, occupation and establishment size (thousands) | Annual |
|
| Employment by sex, occupation and establishment size (thousands) | Quarterly |
|
| Employment by sex, occupation and multiple job holding (thousands) | Annual |
|
| Employment by sex, occupation and multiple job holding (thousands) | Quarterly |
|
| Employment by sex and occupation - ISCO level 2 (thousands) | Annual |
|
| Employment by sex and generative AI exposure (thousands) | Annual |
|
| Employment by sex and generative AI exposure (thousands) | Quarterly |
|
| Employment by sex and generative AI exposure (thousands) | Monthly |
|
| Employment by age and occupation - ISCO level 2 (thousands) | Annual |
|
| Employment by sex and public/private sector (thousands) | Annual |
|
| Employment by sex and public/private sector (thousands) | Quarterly |
|
| Employment by sex, public/private sector and rural/urban areas (thousands) | Annual |
|
| Employment by sex, public/private sector and rural/urban areas (thousands) | Quarterly |
|
| Employment by sex, public/private sector and marital status (thousands) | Annual |
|
| Employment by sex, public/private sector and marital status (thousands) | Quarterly |
|
| Employment by sex, public/private sector and disability status (thousands) | Annual |
|
| Employment by sex, public/private sector and disability status (thousands) | Quarterly |
|
| Employment by sex and establishment size (thousands) | Annual |
|
| Employment by sex and establishment size (thousands) | Quarterly |
|
| Employment by sex and establishment size (thousands) | Monthly |
|
| Employment by sex, establishment size and rural / urban areas (thousands) | Annual |
|
| Employment by sex, establishment size and rural / urban areas (thousands) | Quarterly |
|
| Employment by sex, establishment size and marital status (thousands) | Annual |
|
| Employment by sex, establishment size and marital status (thousands) | Quarterly |
|
| Employment by sex, establishment size and disability status (thousands) | Annual |
|
| Employment by sex, establishment size and disability status (thousands) | Quarterly |
|
| Employment by sex and weekly hours actually worked (thousands) | Annual |
|
| Employment by sex and weekly hours actually worked (thousands) | Quarterly |
|
| Employment by sex, weekly hours actually worked and education (thousands) | Annual |
|
| Employment by sex, weekly hours actually worked and education (thousands) | Quarterly |
|
| Employment by sex, weekly hours actually worked and rural / urban areas (thousands) | Annual |
|
| Employment by sex, weekly hours actually worked and rural / urban areas (thousands) | Quarterly |
|
| Employment by sex, weekly hours actually worked and marital status (thousands) | Annual |
|
| Employment by sex, weekly hours actually worked and marital status (thousands) | Quarterly |
|
| Employment by sex, weekly hours actually worked and disability status (thousands) | Annual |
|
| Employment by sex, weekly hours actually worked and disability status (thousands) | Quarterly |
|
| Employment by sex and multiple-job holding (thousands) | Annual |
|
| Employment by sex and multiple-job holding (thousands) | Quarterly |
|
| Employment by sex, multiple job holding and rural / urban areas (thousands) | Annual |
|
| Employment by sex, multiple job holding and rural / urban areas (thousands) | Quarterly |
|
| Employment by sex, multiple job holding and education (thousands) | Annual |
|
| Employment by sex, multiple job holding and education (thousands) | Quarterly |
|
| Employment by sex, multiple job holding and marital status (thousands) | Annual |
|
| Employment by sex, multiple job holding and marital status (thousands) | Quarterly |
|
| Employment by sex, multiple job holding and disability status (thousands) | Annual |
|
| Employment by sex, multiple job holding and disability status (thousands) | Quarterly |
|
|
▸
Employment, SA (previous ILO definition)
4 tables
|
||
| Employment, SA by sex and age (thousands) | Quarterly |
|
| Employment, SA by sex and age (thousands) | Monthly |
|
| Employment, SA by sex and economic activity (thousands) | Quarterly |
|
| Employment, SA by sex and economic activity (thousands) | Monthly |
|
|
▸
Employment-to-population ratio (previous ILO definition)
35 tables
|
||
| Employment-to-population ratio by sex and age (%) | Annual |
|
| Employment-to-population ratio by sex and age (%) | Quarterly |
|
| Employment-to-population ratio by sex and age (%) | Monthly |
|
| Employment-to-population ratio by sex, age and education (%) | Annual |
|
| Employment-to-population ratio by sex, age and education (%) | Quarterly |
|
| Employment-to-population ratio by sex, age and education (%) | Monthly |
|
| Employment-to-population ratio by sex, age and rural / urban areas (%) | Annual |
|
| Employment-to-population ratio by sex, age and rural / urban areas (%) | Quarterly |
|
| Employment-to-population ratio by sex, age and rural / urban areas (%) | Monthly |
|
| Employment-to-population ratio by sex, age and marital status (%) | Annual |
|
| Employment-to-population ratio by sex, age and marital status (%) | Quarterly |
|
| Employment-to-population ratio by sex, age and disability status (%) | Annual |
|
| Employment-to-population ratio by sex, age and disability status (%) | Quarterly |
|
| Employment-to-population ratio by sex and education (%) | Annual |
|
| Employment-to-population ratio by sex and education (%) | Quarterly |
|
| Employment-to-population ratio by sex and education (%) | Monthly |
|
| Employment-to-population ratio by sex, education and rural / urban areas (%) | Annual |
|
| Employment-to-population ratio by sex, education and rural / urban areas (%) | Quarterly |
|
| Employment-to-population ratio by sex, education and marital status (%) | Annual |
|
| Employment-to-population ratio by sex, education and marital status (%) | Quarterly |
|
| Employment-to-population ratio by sex, education and disability status (%) | Annual |
|
| Employment-to-population ratio by sex and rural / urban areas (%) | Annual |
|
| Employment-to-population ratio by sex and rural / urban areas (%) | Quarterly |
|
| Employment-to-population ratio by sex and rural / urban areas (%) | Monthly |
|
| Employment-to-population ratio by sex, rural / urban area and marital status (%) | Annual |
|
| Employment-to-population ratio by sex, rural / urban area and marital status (%) | Quarterly |
|
| Employment-to-population ratio by sex, rural / urban areas and disability status (%) | Annual |
|
| Employment-to-population ratio by sex, rural / urban areas and disability status (%) | Quarterly |
|
| Employment-to-population ratio by sex and marital status (%) | Annual |
|
| Employment-to-population ratio by sex and marital status (%) | Quarterly |
|
| Employment-to-population ratio by sex and marital status (%) | Monthly |
|
| Employment-to-population ratio by sex, marital status and disability status (%) | Annual |
|
| Employment-to-population ratio by sex, marital status and disability status (%) | Quarterly |
|
| Employment-to-population ratio by sex and disability status (%) | Annual |
|
| Employment-to-population ratio by sex and disability status (%) | Quarterly |
|
|
▸
Prime-age employment-to-population ratio (previous ILO definition)
2 tables
|
||
| Prime-age employment-to-population ratio by sex, household type and presence of children (%) | Annual |
|
| Prime-age employment-to-population ratio by sex, household type and rural / urban areas (%) | Annual |
|
|
▸
Employment-to-population ratio, SA (previous ILO definition)
2 tables
|
||
| Employment-to-population ratio, SA by sex and age (%) | Quarterly |
|
| Employment-to-population ratio, SA by sex and age (%) | Monthly |
|
|
▸
Incidence of part-time employment (previous ILO definition)
1 table
|
||
| Incidence of part-time employment by sex (%) | Annual |
|
|
▸
Youth employment (previous ILO definition)
10 tables
|
||
| Youth employment by sex, age and education (thousands) | Annual |
|
| Youth employment by sex, age and rural / urban areas (thousands) | Annual |
|
| Youth employment by sex, age and disability status (thousands) | Annual |
|
| Youth employment by sex, age and school attendance status (thousands) | Annual |
|
| Youth employment by sex, age and status in employment (thousands) | Annual |
|
| Youth employment by sex, age and economic activity (thousands) | Annual |
|
| Youth employment by sex, age and occupation (thousands) | Annual |
|
| Youth employment by sex, age and generative AI exposure (thousands) | Annual |
|
| Youth employment by sex, age and weekly hours actually worked (thousands) | Annual |
|
| Youth employment by sex, age and working time arrangement (thousands) | Annual |
|
|
▸
Youth employment-to-population ratio (previous ILO definition)
4 tables
|
||
| Youth employment-to-population ratio by sex, age and disability status (%) | Annual |
|
| Youth employment-to-population ratio by sex, age and education (%) | Annual |
|
| Youth employment-to-population ratio by sex, age and rural / urban areas (%) | Annual |
|
| Youth employment-to-population ratio by sex, age and school attendance status (%) | Annual |
|
|
▸
Employment (ILO modelled estimates)
5 tables
|
||
| Employment by sex and age -- ILO modelled estimates, Nov. 2025 (thousands) | Annual |
|
| Employment by sex and status in employment -- ILO modelled estimates, Nov. 2025 (thousands) | Annual |
|
| Employment by age and status in employment -- ILO modelled estimates, Nov. 2025 (thousands) | Annual |
|
| Employment by sex and economic activity -- ILO modelled estimates, Nov. 2025 (thousands) | Annual |
|
| Employment by sex and occupation -- ILO modelled estimates, Nov. 2025 (thousands) | Annual |
|
|
▸
Employment-to-population ratio (ILO modelled estimates)
1 table
|
||
| Employment-to-population ratio by sex and age -- ILO modelled estimates, Nov. 2025 (%) | Annual |
|
|
▸
Full-time equivalent employment (ILO modelled estimates)
1 table
|
||
| Full-time equivalent employment by sex -- ILO modelled estimates, Nov. 2025 (thousands) | Annual |
|
|
▸
Employment (current ILO definition)
10 tables
|
||
| Employment by sex and age -- 19th ICLS (thousands) | Annual |
|
| Employment by sex and age -- 19th ICLS (thousands) | Quarterly |
|
| Employment by sex and status in employment -- 19th ICLS (thousands) | Annual |
|
| Employment by sex and status in employment -- 19th ICLS (thousands) | Quarterly |
|
| Employment by sex and economic activity -- 19th ICLS (thousands) | Annual |
|
| Employment by sex and economic activity -- 19th ICLS (thousands) | Quarterly |
|
| Employment by sex and occupation -- 19th ICLS (thousands) | Annual |
|
| Employment by sex and occupation -- 19th ICLS (thousands) | Quarterly |
|
| Employment by sex and occupation - ISCO level 2 -- 19th ICLS (thousands) | Annual |
|
| Employment by sex and occupation - ISCO level 2 -- 19th ICLS (thousands) | Quarterly |
|
|
▸
Employment-to-population ratio (current ILO definition)
2 tables
|
||
| Employment-to-population ratio by sex and age -- 19th ICLS (%) | Annual |
|
| Employment-to-population ratio by sex and age -- 19th ICLS (%) | Quarterly |
|
Latest posts


Analytical publications
Note: Many publications are available only in English. If available in other languages, a new page will open displaying the options on the right.

Digital labour platforms: Number of platforms and workers
This brief examines the growth of digital labour platforms and provides updated estimates on the number of active platforms and workers engaged through them. It highlights persistent measurement gaps and underscores the need for internationally agreed statistical standards to improve comparability and inform policy.

Employment and Social Trends 2026
This report examines the state of global labour markets, highlighting stable headline employment alongside stalled progress in job quality and widening inequalities. The report analyses productivity, demographic and economic pressures shaping work in the year ahead and outlines the challenges to achieving more inclusive growth.
The State of Social Justice 2025
This report evaluates key indicators used to measure the global progress and ongoing challenges in achieving social justice, building on the premise of the ILO

World Employment and Social Outlook: May 2025 Update
The latest edition of the World Employment and Social Outlook (WESO) Trends reveals new data on job growth forecasts, shifting employment trends, income inequality, and the implications of technological change. It also explores the risks tied to rising geopolitical tensions and trade disruptions, and their ripple effects across regions and sectors.

World Employment and Social Outlook: Trends 2025
The WESO Trends 2025 report provides an in-depth analysis of global labour market trends, highlighting the impacts of slowing economic recovery, persistent youth unemployment, and gender disparities. It examines the structural challenges facing workers worldwide and offers insights into regional and global patterns shaping the future of work.
The working poor… or how a job is no guarantee of decent living conditions
This issue of ILOSTAT’s Spotlight on work statistics focuses on employed people living in extreme poverty around the world. Using ILO’s global estimates of employment by economic class, it shows the great progress achieved during the last few decades in reducing working poverty in the world, and how more effort is still needed to completely eradicate it, particularly considering the strong regional disparities.

Where are the jobs?
This brief casts light on the trends in employment by sector and occupation, by focusing first on the broad sectors and occupations at the global level before moving on to analysing regional patterns.
Methods

Worker and sector profiles (PROFILES database)
Concise description of concepts and definitions, uses, sources and limitations of indicators in the Worker and Sector Profiles, including definitions for the groups of occupations and/or sectors recombined to create these profiles.
Labour Force Statistics (LFS and RURBAN databases)
Concise description of concepts and definitions, uses, sources and limitations for labour force statistics in various databases (LFS, STLFS, RURBAN).
Work Statistics – 19th ICLS (WORK database)
Concise description of concepts and definitions, uses, sources and limitations for (paid and unpaid) work statistics based on the 19th ICLS standards.

ILO Modelled Estimates (ILOEST database)
Discover the methods behind the ILO’s modelled estimates on labour force statistics (including the working poor), labour productivity, wage growth and labour migration.
International Standard Industrial Classification of All Economic Activities (ISIC)
ISIC is a standard classification of economic activities arranged so that entities can be classified according to the activity they carry out.

International Standard Classification of Occupations (ISCO)
ISCO is a statistical framework that organizes jobs into a clearly defined set of groups according to the tasks and duties undertaken in the job.
International Classifications of Status in Employment and Status at Work (ICSE and ICSaW)
See the latest international classifications for all forms of work and for employment according to type of authority and economic risk.
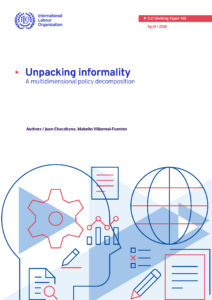
Unpacking informality: A multidimensional policy decomposition
This working paper presents a practical additive decomposition of informal employment, showing where policy action can reduce it. Applied to the case of Colombia, it identifies the main factors behind recent declines in informality.
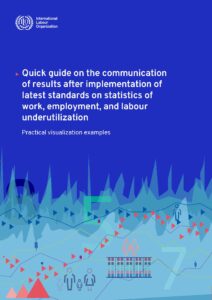
Quick guide on the communication of results after implementation of latest standards on statistics of work, employment, and labour underutilization
A crucial aspect of the implementation of latest labour statistics standards is the effective communication of the results, to ensure getting the best out of the data. This guide aims to provide practical data visualization examples to convey clearly and intuitively the impact of methodological changes on key labour indicators following the implementation of the 19th ICLS resolution and avoid misinterpretation of the results.
Survey Questions for Collecting Data on Work Relationships and Informality
This document provides recommended survey questions for collecting data on work relationships (ICSE-18), informal employment, and the classification of economic units across three sectors: informal, formal, and household own-use production and community sector. (HOC). It incorporates the 20th ICLS resolution on work relationships (ICSE-18) and the 21st ICLS resolution on statistics for the informal economy.
Note on the implementation of statistical standards from the 19th, 20th and 21st ICLS through household surveys
This note provides an overview of the requirements to apply the latest statistical standards through household surveys.
The International Standard Classification of Occupations (ISCO-08) companion guide
This companion guide provides guidance on the practical aspects of adapting ISCO-08 for national use or developing a national classification related to it.
International Classification of Status in Employment (ICSE-18) manual
A resolution adopted at the 20th ICLS includes a new international classification of status in employment (ICSE-18). This manual describes the revised classification, how it differs from the previous version, and how to implement it in a household survey.
Quick guide to understanding the impact of the new statistical standards on ILOSTAT databases
This quick guide explains the differences between the 13th and 19th ICLS standards, the impact of the revisions on headline indicators, and how the ILO handles this on ILOSTAT.

Defining and measuring remote work, telework, work at home and home-based work
Working from a distance and working at home are not new phenomena but the relevance of their measurement has increased, not least due to the Covid-19 pandemic. This notes provide guidance to data producers on how the four different concepts of remote work, telework, work at home and home-based work should be statistically understood, how they relate to each other, and how they can be measured through a household survey.

Capturing impacts on employment and unpaid work using Rapid Surveys
Lack of data on how households and workers are being impacted by the pandemic can severely affect the formulation of programmes and policies aimed to help those most in need. In times of crisis, rapid surveys may be an alternative source of information where official household surveys such as LFS have been halted or postponed. This note provides modules for rapid surveys to shed light on the COVID-19 impacts on paid and unpaid work.

