Mistake #1: Being misled by similar terms
Words that appear to be synonymous in everyday language may sometimes refer to different concepts in labour statistics and, consequently, to different indicators in the ILO databases.
There are many other potentially confusing labour market terms. For instance, consider the cognate words “employees” and “employed”. Not all employed persons are employees. Employees are in paid employment and hold employment contracts, which entitle them to a basic remuneration. Employed persons, on the other hand, include not only employees but also the self-employed, whose remuneration depends on the profits they derive from the goods and services produced or provided by them.
When in doubt, avoid mixing up similar terms by consulting the concepts and definitions page on the ILOSTAT website. It contains a wide range of resources that will help you to understand labour statistics better, from a glossary to in-depth guides and manuals.
Mistake #2: Assuming that all data are created equally
Despite the existence of statistical standards and guidelines and the ILO’s efforts to produce harmonized data series based on these, not all data are comparable.
Let us take a closer look at the standard definition of unemployment, which classifies working-age persons as unemployed if they (a) are not in employment, (b) are currently available to take up employment and (c) have been carrying out activities to seek employment. Some countries apply only part of this definition, requiring just two of the three criteria to be fulfilled for someone to count as unemployed. This inevitably distorts cross‑country comparisons.
Excluding the criterion of seeking work from the definition of unemployment leads to the unemployment rate being greatly overestimated. In some countries, the officially reported rate can be two to three times higher than what it would be if all three criteria were to be used.
Meanwhile, excluding the criterion of current availability to take up employment usually leads to a more subtle overestimation of the unemployment rate because people who are actively looking for work are most often available to take up a job, should one turn up.
This example highlights the importance of taking into account any caveats relating to the definition of indicators or to the methodologies for measuring them. Differences in the approaches followed by countries will almost certainly have an impact on cross-country comparisons.
The good news is that the number of such caveats is limited, since most data in the ILO databases come from the Department of Statistics’ microdata processing, where international standards are consistently applied.
Mistake #3: Ignoring glaring errors
If something does not look right, it probably is indeed a mistake. All of the data on the ILOSTAT portal undergo extensive verification, whether they are reported by member States or produced by our team. However, given that millions of new data points are published on the portal every year, some errors may well slip through occasionally. Whenever in doubt, it is always best to check with us.
Mistake #4: Focusing on the wrong metrics
The unemployment rate is the labour market indicator used most frequently by analysts and journalists worldwide. However, relying on this indicator alone provides but a limited picture of the labour market situation. This is particularly so in countries with decent work deficits beyond high unemployment, such as inadequate working conditions and lack of social protection; it is also generally the case at times of crisis.
Let us take the COVID-19 crisis as an example. In assessing the extent of the disruption it has caused in labour markets, it is not sufficient to focus exclusively on the evolution of the unemployment rate, as that does not capture workers who experience a reduction in the number of hours worked, or who transition into temporary or permanent inactivity.
The ILO Monitor series on COVID-19 and the world of work uses information on workplace closures, working-hour losses, informality, unemployment and inactivity rates to quantify and analyse the effects of the crisis. For more information, check out the latest edition of the ILO Monitor.
The more than 400 indicators covered by the ILOSTAT portal, which contains over 100 million data points, will invariably enable you to expand the scope of your analysis.
Mistake #5: Not using the Data Explorer fully
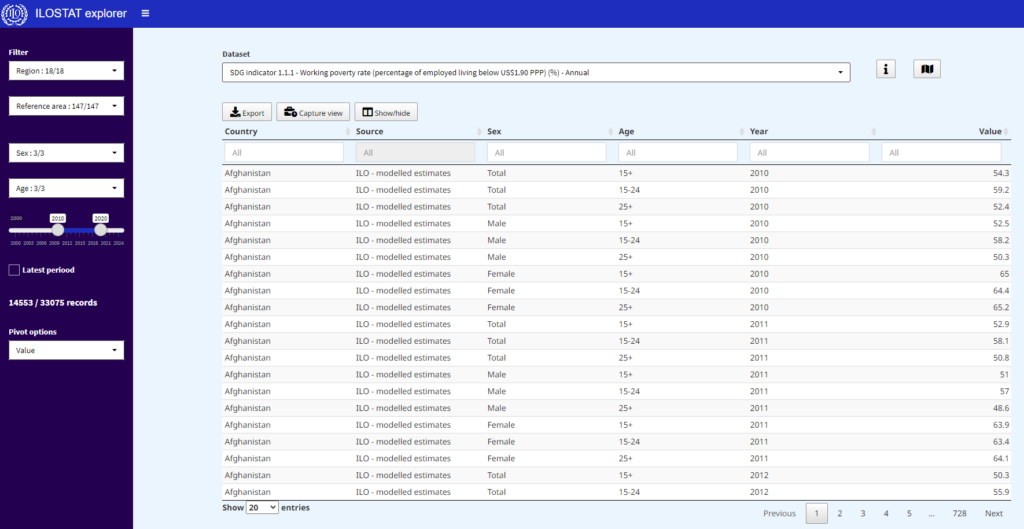
The majority of users will get the most out of the data on the ILOSTAT portal by working with its inbuilt Data Explorer. This interactive tool has numerous valuable features, although it may not be immediately obvious how to use some of them.
Here is a recap of the main functions in the Data Explorer:
Concluding remarks
Whether you are only just starting to use the ILO’s labour statistics or are a seasoned data scientist, I hope that you have found these tips useful. Below are some quick links for your reference. If you still need help with navigating the ILOSTAT portal and database, please do not hesitate to get in touch. Chances are that I will be the one responding to your enquiry!