Statistics on the population and labour force describe the size and composition of the population of working age and those actively engaged in the labour market. ILOSTAT presents data on labour force participation and related indicators used to analyse labour supply across countries.
Data catalogue
|
▸
Population
67 tables
|
||
| Working-age population by sex and age (thousands) | Annual |
|
| Working-age population by sex and age (thousands) | Quarterly |
|
| Working-age population by sex and age (thousands) | Monthly |
|
| Working-age population by sex, age and education (thousands) | Annual |
|
| Working-age population by sex, age and education (thousands) | Quarterly |
|
| Working-age population by sex, age and education (thousands) | Monthly |
|
| Working-age population by sex, age and rural / urban areas (thousands) | Annual |
|
| Working-age population by sex, age and rural / urban areas (thousands) | Quarterly |
|
| Working-age population by sex, age and rural / urban areas (thousands) | Monthly |
|
| Working-age population by sex, age and marital status (thousands) | Annual |
|
| Working-age population by sex, age and marital status (thousands) | Quarterly |
|
| Working-age population by sex, age and disability status (thousands) | Annual |
|
| Working-age population by sex, age and disability status (thousands) | Quarterly |
|
| Working-age population by sex, age and labour market status (thousands) | Annual |
|
| Working-age population by sex, age and labour market status (thousands) | Quarterly |
|
| Working-age population by sex, age and labour market status (thousands) | Monthly |
|
| Working-age population by sex and education (thousands) | Annual |
|
| Working-age population by sex and education (thousands) | Quarterly |
|
| Working-age population by sex and education (thousands) | Monthly |
|
| Working-age population by sex, education and rural / urban areas (thousands) | Annual |
|
| Working-age population by sex, education and rural / urban areas (thousands) | Quarterly |
|
| Working-age population by sex, education and marital status (thousands) | Annual |
|
| Working-age population by sex, education and marital status (thousands) | Quarterly |
|
| Working-age population by sex, education and disability status (thousands) | Annual |
|
| Working-age population by sex, education and labour market status (thousands) | Annual |
|
| Working-age population by sex, education and labour market status (thousands) | Quarterly |
|
| Working-age population by sex, education and labour market status (thousands) | Monthly |
|
| Working-age population by sex and rural / urban areas (thousands) | Annual |
|
| Working-age population by sex and rural / urban areas (thousands) | Quarterly |
|
| Working-age population by sex and rural / urban areas (thousands) | Monthly |
|
| Working-age population by sex, rural / urban area and marital status (thousands) | Annual |
|
| Working-age population by sex, rural / urban area and marital status (thousands) | Quarterly |
|
| Working-age population by sex, rural / urban areas and disability status (thousands) | Annual |
|
| Working-age population by sex, rural / urban areas and disability status (thousands) | Quarterly |
|
| Working-age population by sex, rural / urban areas and labour market status (thousands) | Annual |
|
| Working-age population by sex, rural / urban areas and labour market status (thousands) | Quarterly |
|
| Working-age population by sex, rural / urban areas and labour market status (thousands) | Monthly |
|
| Working-age population by sex and marital status (thousands) | Annual |
|
| Working-age population by sex and marital status (thousands) | Quarterly |
|
| Working-age population by sex and marital status (thousands) | Monthly |
|
| Working-age population by sex, marital status and disability status (thousands) | Annual |
|
| Working-age population by sex, marital status and disability status (thousands) | Quarterly |
|
| Working-age population by sex, marital status and labour market status (thousands) | Annual |
|
| Working-age population by sex, marital status and labour market status (thousands) | Quarterly |
|
| Working-age population by sex, marital status and labour market status (thousands) | Monthly |
|
| Working-age population by sex and disability status (thousands) | Annual |
|
| Working-age population by sex and disability status (thousands) | Quarterly |
|
| Working-age population by sex, disability status and labour market status (thousands) | Annual |
|
| Working-age population by sex, disability status and labour market status (thousands) | Quarterly |
|
| Working-age population by sex and labour market status (thousands) | Annual |
|
| Working-age population by sex and labour market status (thousands) | Quarterly |
|
| Working-age population by sex and labour market status (thousands) | Monthly |
|
| Prime-age population by household type (thousands) | Annual |
|
| Youth working-age population by sex, age and education (thousands) | Annual |
|
| Youth working-age population by sex, age and rural / urban areas (thousands) | Annual |
|
| Youth working-age population by sex, age and school attendance status (thousands) | Annual |
|
| Youth working-age population by sex, age and disability status (thousands) | Annual |
|
| Youth working-age population by sex, age and labour market status (thousands) | Annual |
|
| Youth working-age population by sex, age and stages of transition (thousands) | Annual |
|
| Youth working-age population by sex, rural / urban areas and stages of transition (thousands) | Annual |
|
| Youth working-age population by sex, education and stages of transition (thousands) | Annual |
|
| Youth working-age population by sex, age and forms of transition (thousands) | Annual |
|
| Youth working-age population by sex, rural / urban areas and forms of transition (thousands) | Annual |
|
| Youth working-age population by sex, education and forms of transition (thousands) | Annual |
|
| Population by sex -- UN estimates and projections, July 2024 (thousands) | Annual |
|
| Working-age population by sex and age -- UN estimates and projections, July 2024 (thousands) | Annual |
|
| Labour dependency ratio -- ILO modelled estimates, Nov. 2025 | Annual |
|
|
▸
Labour force
93 tables
|
||
| Labour force by sex and age (thousands) | Annual |
|
| Labour force by sex and age (thousands) | Quarterly |
|
| Labour force by sex and age (thousands) | Monthly |
|
| Labour force, SA by sex and age (thousands) | Quarterly |
|
| Labour force, SA by sex and age (thousands) | Monthly |
|
| Labour force by sex, age and education (thousands) | Annual |
|
| Labour force by sex, age and education (thousands) | Quarterly |
|
| Labour force by sex, age and education (thousands) | Monthly |
|
| Labour force by sex, age and rural / urban areas (thousands) | Annual |
|
| Labour force by sex, age and rural / urban areas (thousands) | Quarterly |
|
| Labour force by sex, age and rural / urban areas (thousands) | Monthly |
|
| Labour force by sex, age and marital status (thousands) | Annual |
|
| Labour force by sex, age and marital status (thousands) | Quarterly |
|
| Labour force by sex, age and disability status (thousands) | Annual |
|
| Labour force by sex, age and disability status (thousands) | Quarterly |
|
| Labour force by sex and education (thousands) | Annual |
|
| Labour force by sex and education (thousands) | Quarterly |
|
| Labour force by sex and education (thousands) | Monthly |
|
| Labour force by sex, education and rural / urban areas (thousands) | Annual |
|
| Labour force by sex, education and rural / urban areas (thousands) | Quarterly |
|
| Labour force by sex, education and marital status (thousands) | Annual |
|
| Labour force by sex, education and marital status (thousands) | Quarterly |
|
| Labour force by sex, education and disability status (thousands) | Annual |
|
| Labour force by sex and rural / urban areas (thousands) | Annual |
|
| Labour force by sex and rural / urban areas (thousands) | Quarterly |
|
| Labour force by sex and rural / urban areas (thousands) | Monthly |
|
| Labour force by sex, rural / urban area and marital status (thousands) | Annual |
|
| Labour force by sex, rural / urban area and marital status (thousands) | Quarterly |
|
| Labour force by sex, rural / urban areas and disability status (thousands) | Annual |
|
| Labour force by sex, rural / urban areas and disability status (thousands) | Quarterly |
|
| Labour force by sex and marital status (thousands) | Annual |
|
| Labour force by sex and marital status (thousands) | Quarterly |
|
| Labour force by sex and marital status (thousands) | Monthly |
|
| Labour force by sex, marital status and disability status (thousands) | Annual |
|
| Labour force by sex, marital status and disability status (thousands) | Quarterly |
|
| Labour force by sex and disability status (thousands) | Annual |
|
| Labour force by sex and disability status (thousands) | Quarterly |
|
| Labour force participation rate by sex and age (%) | Annual |
|
| Labour force participation rate by sex and age (%) | Quarterly |
|
| Labour force participation rate by sex and age (%) | Monthly |
|
| Labour force participation rate, SA by sex and age (%) | Quarterly |
|
| Labour force participation rate, SA by sex and age (%) | Monthly |
|
| Labour force participation rate by sex, age and education (%) | Annual |
|
| Labour force participation rate by sex, age and education (%) | Quarterly |
|
| Labour force participation rate by sex, age and education (%) | Monthly |
|
| Labour force participation rate by sex, age and rural / urban areas (%) | Annual |
|
| Labour force participation rate by sex, age and rural / urban areas (%) | Quarterly |
|
| Labour force participation rate by sex, age and rural / urban areas (%) | Monthly |
|
| Labour force participation rate by sex, age and marital status (%) | Annual |
|
| Labour force participation rate by sex, age and marital status (%) | Quarterly |
|
| Labour force participation rate by sex, age and disability status (%) | Annual |
|
| Labour force participation rate by sex, age and disability status (%) | Quarterly |
|
| Labour force participation rate by sex and education (%) | Annual |
|
| Labour force participation rate by sex and education (%) | Quarterly |
|
| Labour force participation rate by sex and education (%) | Monthly |
|
| Labour force participation rate by sex, education and rural / urban areas (%) | Annual |
|
| Labour force participation rate by sex, education and rural / urban areas (%) | Quarterly |
|
| Labour force participation rate by sex, education and marital status (%) | Annual |
|
| Labour force participation rate by sex, education and marital status (%) | Quarterly |
|
| Labour force participation rate by sex, education and disability status (%) | Annual |
|
| Labour force participation rate by sex and rural / urban areas (%) | Annual |
|
| Labour force participation rate by sex and rural / urban areas (%) | Quarterly |
|
| Labour force participation rate by sex and rural / urban areas (%) | Monthly |
|
| Labour force participation rate by sex, rural / urban area and marital status (%) | Annual |
|
| Labour force participation rate by sex, rural / urban area and marital status (%) | Quarterly |
|
| Labour force participation rate by sex, rural / urban areas and disability status (%) | Annual |
|
| Labour force participation rate by sex, rural / urban areas and disability status (%) | Quarterly |
|
| Labour force participation rate by sex and marital status (%) | Annual |
|
| Labour force participation rate by sex and marital status (%) | Quarterly |
|
| Labour force participation rate by sex and marital status (%) | Monthly |
|
| Labour force participation rate by sex, marital status and disability status (%) | Annual |
|
| Labour force participation rate by sex, marital status and disability status (%) | Quarterly |
|
| Labour force participation rate by sex and disability status (%) | Annual |
|
| Labour force participation rate by sex and disability status (%) | Quarterly |
|
| Prime-age labour force participation rate by sex and household type (%) | Annual |
|
| Prime-age labour force participation rate by sex, household type and rural / urban areas (%) | Annual |
|
| Prime-age labour force participation rate by sex, household type and presence of children (%) | Annual |
|
| Youth labour force by sex, age and education (thousands) | Annual |
|
| Youth labour force by sex, age and rural / urban areas (thousands) | Annual |
|
| Youth labour force by sex, age and school attendance status (thousands) | Annual |
|
| Youth labour force by sex, age and disability status (thousands) | Annual |
|
| Youth labour force participation rate by sex, age and education (%) | Annual |
|
| Youth labour force participation rate by sex, age and rural / urban areas (%) | Annual |
|
| Youth labour force participation rate by sex, age and disability status (%) | Annual |
|
| Youth labour force participation rate by sex, age and school attendance status (%) | Annual |
|
| Labour force by sex and age -- ILO modelled estimates, Nov. 2025 (thousands) | Annual |
|
| Labour force participation rate by sex and age -- ILO modelled estimates, Nov. 2025 (%) | Annual |
|
| Prime-age labour force participation rate by sex and household type -- ILO modelled estimates, Nov. 2023 (%) | Annual |
|
| Prime-age labour force by sex and household type -- ILO modelled estimates, Nov. 2023 (thousands) | Annual |
|
| Labour force by sex and age -- 19th ICLS (thousands) | Annual |
|
| Labour force by sex and age -- 19th ICLS (thousands) | Quarterly |
|
| Labour force participation rate by sex and age -- 19th ICLS (%) | Annual |
|
| Labour force participation rate by sex and age -- 19th ICLS (%) | Quarterly |
|
|
▸
Labour Force Statistics (LFS)
19 tables
|
||
| Working-age population by sex and age (thousands) | Annual |
|
| Working-age population by sex and age (thousands) | Quarterly |
|
| Working-age population by sex and age (thousands) | Monthly |
|
| Working-age population by sex, age and labour market status (thousands) | Annual |
|
| Working-age population by sex, age and labour market status (thousands) | Quarterly |
|
| Working-age population by sex, age and labour market status (thousands) | Monthly |
|
| Working-age population by sex and labour market status (thousands) | Annual |
|
| Working-age population by sex and labour market status (thousands) | Quarterly |
|
| Working-age population by sex and labour market status (thousands) | Monthly |
|
| Labour force by sex and age (thousands) | Annual |
|
| Labour force by sex and age (thousands) | Quarterly |
|
| Labour force by sex and age (thousands) | Monthly |
|
| Labour force, SA by sex and age (thousands) | Quarterly |
|
| Labour force, SA by sex and age (thousands) | Monthly |
|
| Labour force participation rate by sex and age (%) | Annual |
|
| Labour force participation rate by sex and age (%) | Quarterly |
|
| Labour force participation rate by sex and age (%) | Monthly |
|
| Labour force participation rate, SA by sex and age (%) | Quarterly |
|
| Labour force participation rate, SA by sex and age (%) | Monthly |
|
|
▸
ILO Modelled Estimates (ILOEST)
7 tables
|
||
| Population by sex -- UN estimates and projections, July 2024 (thousands) | Annual |
|
| Working-age population by sex and age -- UN estimates and projections, July 2024 (thousands) | Annual |
|
| Labour dependency ratio -- ILO modelled estimates, Nov. 2025 | Annual |
|
| Labour force by sex and age -- ILO modelled estimates, Nov. 2025 (thousands) | Annual |
|
| Labour force participation rate by sex and age -- ILO modelled estimates, Nov. 2025 (%) | Annual |
|
| Prime-age labour force participation rate by sex and household type -- ILO modelled estimates, Nov. 2023 (%) | Annual |
|
| Prime-age labour force by sex and household type -- ILO modelled estimates, Nov. 2023 (thousands) | Annual |
|
|
▸
Work Statistics -- 19th ICLS (WORK)
4 tables
|
||
| Labour force by sex and age -- 19th ICLS (thousands) | Annual |
|
| Labour force by sex and age -- 19th ICLS (thousands) | Quarterly |
|
| Labour force participation rate by sex and age -- 19th ICLS (%) | Annual |
|
| Labour force participation rate by sex and age -- 19th ICLS (%) | Quarterly |
|
|
▸
Youth Labour Market Indicators (YouthSTATS)
19 tables
|
||
| Youth working-age population by sex, age and education (thousands) | Annual |
|
| Youth working-age population by sex, age and rural / urban areas (thousands) | Annual |
|
| Youth working-age population by sex, age and school attendance status (thousands) | Annual |
|
| Youth working-age population by sex, age and disability status (thousands) | Annual |
|
| Youth working-age population by sex, age and labour market status (thousands) | Annual |
|
| Youth working-age population by sex, age and stages of transition (thousands) | Annual |
|
| Youth working-age population by sex, rural / urban areas and stages of transition (thousands) | Annual |
|
| Youth working-age population by sex, education and stages of transition (thousands) | Annual |
|
| Youth working-age population by sex, age and forms of transition (thousands) | Annual |
|
| Youth working-age population by sex, rural / urban areas and forms of transition (thousands) | Annual |
|
| Youth working-age population by sex, education and forms of transition (thousands) | Annual |
|
| Youth labour force by sex, age and education (thousands) | Annual |
|
| Youth labour force by sex, age and rural / urban areas (thousands) | Annual |
|
| Youth labour force by sex, age and school attendance status (thousands) | Annual |
|
| Youth labour force by sex, age and disability status (thousands) | Annual |
|
| Youth labour force participation rate by sex, age and education (%) | Annual |
|
| Youth labour force participation rate by sex, age and rural / urban areas (%) | Annual |
|
| Youth labour force participation rate by sex, age and disability status (%) | Annual |
|
| Youth labour force participation rate by sex, age and school attendance status (%) | Annual |
|
|
▸
Gender Equality and Non-Discrimination Indicators (GEND)
22 tables
|
||
| Working-age population by sex, age and marital status (thousands) | Annual |
|
| Working-age population by sex, age and marital status (thousands) | Quarterly |
|
| Working-age population by sex and marital status (thousands) | Annual |
|
| Working-age population by sex and marital status (thousands) | Quarterly |
|
| Working-age population by sex and marital status (thousands) | Monthly |
|
| Working-age population by sex, marital status and labour market status (thousands) | Annual |
|
| Working-age population by sex, marital status and labour market status (thousands) | Quarterly |
|
| Working-age population by sex, marital status and labour market status (thousands) | Monthly |
|
| Prime-age population by household type (thousands) | Annual |
|
| Labour force by sex, age and marital status (thousands) | Annual |
|
| Labour force by sex, age and marital status (thousands) | Quarterly |
|
| Labour force by sex and marital status (thousands) | Annual |
|
| Labour force by sex and marital status (thousands) | Quarterly |
|
| Labour force by sex and marital status (thousands) | Monthly |
|
| Labour force participation rate by sex, age and marital status (%) | Annual |
|
| Labour force participation rate by sex, age and marital status (%) | Quarterly |
|
| Labour force participation rate by sex and marital status (%) | Annual |
|
| Labour force participation rate by sex and marital status (%) | Quarterly |
|
| Labour force participation rate by sex and marital status (%) | Monthly |
|
| Prime-age labour force participation rate by sex and household type (%) | Annual |
|
| Prime-age labour force participation rate by sex, household type and rural / urban areas (%) | Annual |
|
| Prime-age labour force participation rate by sex, household type and presence of children (%) | Annual |
|
|
▸
Disability Labour Market Indicators (DLMI)
29 tables
|
||
| Working-age population by sex, age and disability status (thousands) | Annual |
|
| Working-age population by sex, age and disability status (thousands) | Quarterly |
|
| Working-age population by sex, education and disability status (thousands) | Annual |
|
| Working-age population by sex, rural / urban areas and disability status (thousands) | Annual |
|
| Working-age population by sex, rural / urban areas and disability status (thousands) | Quarterly |
|
| Working-age population by sex, marital status and disability status (thousands) | Annual |
|
| Working-age population by sex, marital status and disability status (thousands) | Quarterly |
|
| Working-age population by sex and disability status (thousands) | Annual |
|
| Working-age population by sex and disability status (thousands) | Quarterly |
|
| Working-age population by sex, disability status and labour market status (thousands) | Annual |
|
| Working-age population by sex, disability status and labour market status (thousands) | Quarterly |
|
| Labour force by sex, age and disability status (thousands) | Annual |
|
| Labour force by sex, age and disability status (thousands) | Quarterly |
|
| Labour force by sex, education and disability status (thousands) | Annual |
|
| Labour force by sex, rural / urban areas and disability status (thousands) | Annual |
|
| Labour force by sex, rural / urban areas and disability status (thousands) | Quarterly |
|
| Labour force by sex, marital status and disability status (thousands) | Annual |
|
| Labour force by sex, marital status and disability status (thousands) | Quarterly |
|
| Labour force by sex and disability status (thousands) | Annual |
|
| Labour force by sex and disability status (thousands) | Quarterly |
|
| Labour force participation rate by sex, age and disability status (%) | Annual |
|
| Labour force participation rate by sex, age and disability status (%) | Quarterly |
|
| Labour force participation rate by sex, education and disability status (%) | Annual |
|
| Labour force participation rate by sex, rural / urban areas and disability status (%) | Annual |
|
| Labour force participation rate by sex, rural / urban areas and disability status (%) | Quarterly |
|
| Labour force participation rate by sex, marital status and disability status (%) | Annual |
|
| Labour force participation rate by sex, marital status and disability status (%) | Quarterly |
|
| Labour force participation rate by sex and disability status (%) | Annual |
|
| Labour force participation rate by sex and disability status (%) | Quarterly |
|
|
▸
Rural and Urban Labour Markets (RURBAN)
27 tables
|
||
| Working-age population by sex, age and rural / urban areas (thousands) | Annual |
|
| Working-age population by sex, age and rural / urban areas (thousands) | Quarterly |
|
| Working-age population by sex, age and rural / urban areas (thousands) | Monthly |
|
| Working-age population by sex and rural / urban areas (thousands) | Annual |
|
| Working-age population by sex and rural / urban areas (thousands) | Quarterly |
|
| Working-age population by sex and rural / urban areas (thousands) | Monthly |
|
| Working-age population by sex, rural / urban area and marital status (thousands) | Annual |
|
| Working-age population by sex, rural / urban area and marital status (thousands) | Quarterly |
|
| Working-age population by sex, rural / urban areas and labour market status (thousands) | Annual |
|
| Working-age population by sex, rural / urban areas and labour market status (thousands) | Quarterly |
|
| Working-age population by sex, rural / urban areas and labour market status (thousands) | Monthly |
|
| Labour force by sex, age and rural / urban areas (thousands) | Annual |
|
| Labour force by sex, age and rural / urban areas (thousands) | Quarterly |
|
| Labour force by sex, age and rural / urban areas (thousands) | Monthly |
|
| Labour force by sex and rural / urban areas (thousands) | Annual |
|
| Labour force by sex and rural / urban areas (thousands) | Quarterly |
|
| Labour force by sex and rural / urban areas (thousands) | Monthly |
|
| Labour force by sex, rural / urban area and marital status (thousands) | Annual |
|
| Labour force by sex, rural / urban area and marital status (thousands) | Quarterly |
|
| Labour force participation rate by sex, age and rural / urban areas (%) | Annual |
|
| Labour force participation rate by sex, age and rural / urban areas (%) | Quarterly |
|
| Labour force participation rate by sex, age and rural / urban areas (%) | Monthly |
|
| Labour force participation rate by sex and rural / urban areas (%) | Annual |
|
| Labour force participation rate by sex and rural / urban areas (%) | Quarterly |
|
| Labour force participation rate by sex and rural / urban areas (%) | Monthly |
|
| Labour force participation rate by sex, rural / urban area and marital status (%) | Annual |
|
| Labour force participation rate by sex, rural / urban area and marital status (%) | Quarterly |
|
|
▸
Education and Mismatch Indicators (EMI)
33 tables
|
||
| Working-age population by sex, age and education (thousands) | Annual |
|
| Working-age population by sex, age and education (thousands) | Quarterly |
|
| Working-age population by sex, age and education (thousands) | Monthly |
|
| Working-age population by sex and education (thousands) | Annual |
|
| Working-age population by sex and education (thousands) | Quarterly |
|
| Working-age population by sex and education (thousands) | Monthly |
|
| Working-age population by sex, education and rural / urban areas (thousands) | Annual |
|
| Working-age population by sex, education and rural / urban areas (thousands) | Quarterly |
|
| Working-age population by sex, education and marital status (thousands) | Annual |
|
| Working-age population by sex, education and marital status (thousands) | Quarterly |
|
| Working-age population by sex, education and labour market status (thousands) | Annual |
|
| Working-age population by sex, education and labour market status (thousands) | Quarterly |
|
| Working-age population by sex, education and labour market status (thousands) | Monthly |
|
| Labour force by sex, age and education (thousands) | Annual |
|
| Labour force by sex, age and education (thousands) | Quarterly |
|
| Labour force by sex, age and education (thousands) | Monthly |
|
| Labour force by sex and education (thousands) | Annual |
|
| Labour force by sex and education (thousands) | Quarterly |
|
| Labour force by sex and education (thousands) | Monthly |
|
| Labour force by sex, education and rural / urban areas (thousands) | Annual |
|
| Labour force by sex, education and rural / urban areas (thousands) | Quarterly |
|
| Labour force by sex, education and marital status (thousands) | Annual |
|
| Labour force by sex, education and marital status (thousands) | Quarterly |
|
| Labour force participation rate by sex, age and education (%) | Annual |
|
| Labour force participation rate by sex, age and education (%) | Quarterly |
|
| Labour force participation rate by sex, age and education (%) | Monthly |
|
| Labour force participation rate by sex and education (%) | Annual |
|
| Labour force participation rate by sex and education (%) | Quarterly |
|
| Labour force participation rate by sex and education (%) | Monthly |
|
| Labour force participation rate by sex, education and rural / urban areas (%) | Annual |
|
| Labour force participation rate by sex, education and rural / urban areas (%) | Quarterly |
|
| Labour force participation rate by sex, education and marital status (%) | Annual |
|
| Labour force participation rate by sex, education and marital status (%) | Quarterly |
|
|
▸
Working-age population
52 tables
|
||
| Working-age population by sex and age (thousands) | Annual |
|
| Working-age population by sex and age (thousands) | Quarterly |
|
| Working-age population by sex and age (thousands) | Monthly |
|
| Working-age population by sex, age and education (thousands) | Annual |
|
| Working-age population by sex, age and education (thousands) | Quarterly |
|
| Working-age population by sex, age and education (thousands) | Monthly |
|
| Working-age population by sex, age and rural / urban areas (thousands) | Annual |
|
| Working-age population by sex, age and rural / urban areas (thousands) | Quarterly |
|
| Working-age population by sex, age and rural / urban areas (thousands) | Monthly |
|
| Working-age population by sex, age and marital status (thousands) | Annual |
|
| Working-age population by sex, age and marital status (thousands) | Quarterly |
|
| Working-age population by sex, age and disability status (thousands) | Annual |
|
| Working-age population by sex, age and disability status (thousands) | Quarterly |
|
| Working-age population by sex, age and labour market status (thousands) | Annual |
|
| Working-age population by sex, age and labour market status (thousands) | Quarterly |
|
| Working-age population by sex, age and labour market status (thousands) | Monthly |
|
| Working-age population by sex and education (thousands) | Annual |
|
| Working-age population by sex and education (thousands) | Quarterly |
|
| Working-age population by sex and education (thousands) | Monthly |
|
| Working-age population by sex, education and rural / urban areas (thousands) | Annual |
|
| Working-age population by sex, education and rural / urban areas (thousands) | Quarterly |
|
| Working-age population by sex, education and marital status (thousands) | Annual |
|
| Working-age population by sex, education and marital status (thousands) | Quarterly |
|
| Working-age population by sex, education and disability status (thousands) | Annual |
|
| Working-age population by sex, education and labour market status (thousands) | Annual |
|
| Working-age population by sex, education and labour market status (thousands) | Quarterly |
|
| Working-age population by sex, education and labour market status (thousands) | Monthly |
|
| Working-age population by sex and rural / urban areas (thousands) | Annual |
|
| Working-age population by sex and rural / urban areas (thousands) | Quarterly |
|
| Working-age population by sex and rural / urban areas (thousands) | Monthly |
|
| Working-age population by sex, rural / urban area and marital status (thousands) | Annual |
|
| Working-age population by sex, rural / urban area and marital status (thousands) | Quarterly |
|
| Working-age population by sex, rural / urban areas and disability status (thousands) | Annual |
|
| Working-age population by sex, rural / urban areas and disability status (thousands) | Quarterly |
|
| Working-age population by sex, rural / urban areas and labour market status (thousands) | Annual |
|
| Working-age population by sex, rural / urban areas and labour market status (thousands) | Quarterly |
|
| Working-age population by sex, rural / urban areas and labour market status (thousands) | Monthly |
|
| Working-age population by sex and marital status (thousands) | Annual |
|
| Working-age population by sex and marital status (thousands) | Quarterly |
|
| Working-age population by sex and marital status (thousands) | Monthly |
|
| Working-age population by sex, marital status and disability status (thousands) | Annual |
|
| Working-age population by sex, marital status and disability status (thousands) | Quarterly |
|
| Working-age population by sex, marital status and labour market status (thousands) | Annual |
|
| Working-age population by sex, marital status and labour market status (thousands) | Quarterly |
|
| Working-age population by sex, marital status and labour market status (thousands) | Monthly |
|
| Working-age population by sex and disability status (thousands) | Annual |
|
| Working-age population by sex and disability status (thousands) | Quarterly |
|
| Working-age population by sex, disability status and labour market status (thousands) | Annual |
|
| Working-age population by sex, disability status and labour market status (thousands) | Quarterly |
|
| Working-age population by sex and labour market status (thousands) | Annual |
|
| Working-age population by sex and labour market status (thousands) | Quarterly |
|
| Working-age population by sex and labour market status (thousands) | Monthly |
|
|
▸
Prime-age population
1 table
|
||
| Prime-age population by household type (thousands) | Annual |
|
|
▸
Labour force (previous ILO definition)
35 tables
|
||
| Labour force by sex and age (thousands) | Annual |
|
| Labour force by sex and age (thousands) | Quarterly |
|
| Labour force by sex and age (thousands) | Monthly |
|
| Labour force by sex, age and education (thousands) | Annual |
|
| Labour force by sex, age and education (thousands) | Quarterly |
|
| Labour force by sex, age and education (thousands) | Monthly |
|
| Labour force by sex, age and rural / urban areas (thousands) | Annual |
|
| Labour force by sex, age and rural / urban areas (thousands) | Quarterly |
|
| Labour force by sex, age and rural / urban areas (thousands) | Monthly |
|
| Labour force by sex, age and marital status (thousands) | Annual |
|
| Labour force by sex, age and marital status (thousands) | Quarterly |
|
| Labour force by sex, age and disability status (thousands) | Annual |
|
| Labour force by sex, age and disability status (thousands) | Quarterly |
|
| Labour force by sex and education (thousands) | Annual |
|
| Labour force by sex and education (thousands) | Quarterly |
|
| Labour force by sex and education (thousands) | Monthly |
|
| Labour force by sex, education and rural / urban areas (thousands) | Annual |
|
| Labour force by sex, education and rural / urban areas (thousands) | Quarterly |
|
| Labour force by sex, education and marital status (thousands) | Annual |
|
| Labour force by sex, education and marital status (thousands) | Quarterly |
|
| Labour force by sex, education and disability status (thousands) | Annual |
|
| Labour force by sex and rural / urban areas (thousands) | Annual |
|
| Labour force by sex and rural / urban areas (thousands) | Quarterly |
|
| Labour force by sex and rural / urban areas (thousands) | Monthly |
|
| Labour force by sex, rural / urban area and marital status (thousands) | Annual |
|
| Labour force by sex, rural / urban area and marital status (thousands) | Quarterly |
|
| Labour force by sex, rural / urban areas and disability status (thousands) | Annual |
|
| Labour force by sex, rural / urban areas and disability status (thousands) | Quarterly |
|
| Labour force by sex and marital status (thousands) | Annual |
|
| Labour force by sex and marital status (thousands) | Quarterly |
|
| Labour force by sex and marital status (thousands) | Monthly |
|
| Labour force by sex, marital status and disability status (thousands) | Annual |
|
| Labour force by sex, marital status and disability status (thousands) | Quarterly |
|
| Labour force by sex and disability status (thousands) | Annual |
|
| Labour force by sex and disability status (thousands) | Quarterly |
|
|
▸
Labour force, SA (previous ILO definition)
2 tables
|
||
| Labour force, SA by sex and age (thousands) | Quarterly |
|
| Labour force, SA by sex and age (thousands) | Monthly |
|
|
▸
Labour force participation rate (previous ILO definition)
35 tables
|
||
| Labour force participation rate by sex and age (%) | Annual |
|
| Labour force participation rate by sex and age (%) | Quarterly |
|
| Labour force participation rate by sex and age (%) | Monthly |
|
| Labour force participation rate by sex, age and education (%) | Annual |
|
| Labour force participation rate by sex, age and education (%) | Quarterly |
|
| Labour force participation rate by sex, age and education (%) | Monthly |
|
| Labour force participation rate by sex, age and rural / urban areas (%) | Annual |
|
| Labour force participation rate by sex, age and rural / urban areas (%) | Quarterly |
|
| Labour force participation rate by sex, age and rural / urban areas (%) | Monthly |
|
| Labour force participation rate by sex, age and marital status (%) | Annual |
|
| Labour force participation rate by sex, age and marital status (%) | Quarterly |
|
| Labour force participation rate by sex, age and disability status (%) | Annual |
|
| Labour force participation rate by sex, age and disability status (%) | Quarterly |
|
| Labour force participation rate by sex and education (%) | Annual |
|
| Labour force participation rate by sex and education (%) | Quarterly |
|
| Labour force participation rate by sex and education (%) | Monthly |
|
| Labour force participation rate by sex, education and rural / urban areas (%) | Annual |
|
| Labour force participation rate by sex, education and rural / urban areas (%) | Quarterly |
|
| Labour force participation rate by sex, education and marital status (%) | Annual |
|
| Labour force participation rate by sex, education and marital status (%) | Quarterly |
|
| Labour force participation rate by sex, education and disability status (%) | Annual |
|
| Labour force participation rate by sex and rural / urban areas (%) | Annual |
|
| Labour force participation rate by sex and rural / urban areas (%) | Quarterly |
|
| Labour force participation rate by sex and rural / urban areas (%) | Monthly |
|
| Labour force participation rate by sex, rural / urban area and marital status (%) | Annual |
|
| Labour force participation rate by sex, rural / urban area and marital status (%) | Quarterly |
|
| Labour force participation rate by sex, rural / urban areas and disability status (%) | Annual |
|
| Labour force participation rate by sex, rural / urban areas and disability status (%) | Quarterly |
|
| Labour force participation rate by sex and marital status (%) | Annual |
|
| Labour force participation rate by sex and marital status (%) | Quarterly |
|
| Labour force participation rate by sex and marital status (%) | Monthly |
|
| Labour force participation rate by sex, marital status and disability status (%) | Annual |
|
| Labour force participation rate by sex, marital status and disability status (%) | Quarterly |
|
| Labour force participation rate by sex and disability status (%) | Annual |
|
| Labour force participation rate by sex and disability status (%) | Quarterly |
|
|
▸
Labour force participation rate, SA (previous ILO definition)
2 tables
|
||
| Labour force participation rate, SA by sex and age (%) | Quarterly |
|
| Labour force participation rate, SA by sex and age (%) | Monthly |
|
|
▸
Prime-age labour force participation rate (previous ILO definition)
3 tables
|
||
| Prime-age labour force participation rate by sex and household type (%) | Annual |
|
| Prime-age labour force participation rate by sex, household type and rural / urban areas (%) | Annual |
|
| Prime-age labour force participation rate by sex, household type and presence of children (%) | Annual |
|
|
▸
Youth working-age population
11 tables
|
||
| Youth working-age population by sex, age and education (thousands) | Annual |
|
| Youth working-age population by sex, age and rural / urban areas (thousands) | Annual |
|
| Youth working-age population by sex, age and school attendance status (thousands) | Annual |
|
| Youth working-age population by sex, age and disability status (thousands) | Annual |
|
| Youth working-age population by sex, age and labour market status (thousands) | Annual |
|
| Youth working-age population by sex, age and stages of transition (thousands) | Annual |
|
| Youth working-age population by sex, rural / urban areas and stages of transition (thousands) | Annual |
|
| Youth working-age population by sex, education and stages of transition (thousands) | Annual |
|
| Youth working-age population by sex, age and forms of transition (thousands) | Annual |
|
| Youth working-age population by sex, rural / urban areas and forms of transition (thousands) | Annual |
|
| Youth working-age population by sex, education and forms of transition (thousands) | Annual |
|
|
▸
Youth labour force (previous ILO definition)
4 tables
|
||
| Youth labour force by sex, age and education (thousands) | Annual |
|
| Youth labour force by sex, age and rural / urban areas (thousands) | Annual |
|
| Youth labour force by sex, age and school attendance status (thousands) | Annual |
|
| Youth labour force by sex, age and disability status (thousands) | Annual |
|
|
▸
Youth labour force participation rate (previous ILO definition)
4 tables
|
||
| Youth labour force participation rate by sex, age and education (%) | Annual |
|
| Youth labour force participation rate by sex, age and rural / urban areas (%) | Annual |
|
| Youth labour force participation rate by sex, age and disability status (%) | Annual |
|
| Youth labour force participation rate by sex, age and school attendance status (%) | Annual |
|
|
▸
Population (UN estimates and projections)
1 table
|
||
| Population by sex -- UN estimates and projections, July 2024 (thousands) | Annual |
|
|
▸
Working-age population (UN estimates and projections)
1 table
|
||
| Working-age population by sex and age -- UN estimates and projections, July 2024 (thousands) | Annual |
|
|
▸
Labour dependency ratio (ILO modelled estimates)
1 table
|
||
| Labour dependency ratio -- ILO modelled estimates, Nov. 2025 | Annual |
|
|
▸
Labour force (ILO modelled estimates)
1 table
|
||
| Labour force by sex and age -- ILO modelled estimates, Nov. 2025 (thousands) | Annual |
|
|
▸
Labour force participation rate (ILO modelled estimates)
1 table
|
||
| Labour force participation rate by sex and age -- ILO modelled estimates, Nov. 2025 (%) | Annual |
|
|
▸
Prime-age labour force participation rate (ILO modelled estimates)
1 table
|
||
| Prime-age labour force participation rate by sex and household type -- ILO modelled estimates, Nov. 2023 (%) | Annual |
|
|
▸
Prime-age labour force (ILO modelled estimates)
1 table
|
||
| Prime-age labour force by sex and household type -- ILO modelled estimates, Nov. 2023 (thousands) | Annual |
|
|
▸
Labour force (current ILO definition)
2 tables
|
||
| Labour force by sex and age -- 19th ICLS (thousands) | Annual |
|
| Labour force by sex and age -- 19th ICLS (thousands) | Quarterly |
|
|
▸
Labour force participation rate (current ILO definition)
2 tables
|
||
| Labour force participation rate by sex and age -- 19th ICLS (%) | Annual |
|
| Labour force participation rate by sex and age -- 19th ICLS (%) | Quarterly |
|
Latest posts


Analytical publications
Note: Many publications are available only in English. If available in other languages, a new page will open displaying these options.
The State of Social Justice 2025
This report evaluates key indicators used to measure the global progress and ongoing challenges in achieving social justice, building on the premise of the ILO
The role of communication and dissemination in fulfilling the potential of gender-relevant work statistics
The 2013 ICLS resolution introduced a new forms-of-work framework and labour underutilization measures that significantly strengthened the gender relevance of labour statistics. This paper examines the rationale behind these standards, key challenges in their implementation, and the role of communication in maximizing their impact.
Methods
Labour Force Statistics (LFS and RURBAN databases)
Concise description of concepts and definitions, uses, sources and limitations for labour force statistics in various databases (LFS, STLFS, RURBAN).
Work Statistics – 19th ICLS (WORK database)
Concise description of concepts and definitions, uses, sources and limitations for (paid and unpaid) work statistics based on the 19th ICLS standards.

Statistical standards and methods
Resources on methods and statistical standards, particularly for household surveys.
ICLS documents
Find resolutions, guidelines, meeting room documents and reports related to the International Conference of Labour Statisticians (ICLS).

Forms of work: An overview of the new statistical standards
An introduction to the conceptual frameworks for forms of work and labour force statistics, including labour underutilization.

Concepts and definitions
Database descriptions, statistical standards (resolutions and guidelines), and guides and manuals – all the metadata to better understand the labour statistics presented on ILOSTAT.
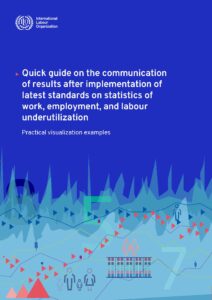
Quick guide on the communication of results after implementation of latest standards on statistics of work, employment, and labour underutilization
A crucial aspect of the implementation of latest labour statistics standards is the effective communication of the results, to ensure getting the best out of the data. This guide aims to provide practical data visualization examples to convey clearly and intuitively the impact of methodological changes on key labour indicators following the implementation of the 19th ICLS resolution and avoid misinterpretation of the results.
Survey Questions for Collecting Data on Work Relationships and Informality
This document provides recommended survey questions for collecting data on work relationships (ICSE-18), informal employment, and the classification of economic units across three sectors: informal, formal, and household own-use production and community sector. (HOC). It incorporates the 20th ICLS resolution on work relationships (ICSE-18) and the 21st ICLS resolution on statistics for the informal economy.

ILOSTAT Microdata Processing Quick Guide: Principles and methods underlying the ILO’s processing of anonymized household survey microdata
This Quick Guide (last updated in September 2024) presents the anonymized microdata processing undertaken by the Data Production and Analysis Unit in the ILO Department of Statistics. It describes why and how the unit carries out this activity, as well as the potential expansion of this work. It also mentions considerations and limitations to take into account by data users.
Note on the implementation of statistical standards from the 19th, 20th and 21st ICLS through household surveys
This note provides an overview of the requirements to apply the latest statistical standards through household surveys.

Own-use provision of services: Measurement guide
This guide provides guidance on implementing the ILO add-on module for own-use provision of services (OPS) in national labour force surveys. It is aimed at low- and middle-income countries and is designed to support NSOs to produce statistics on OPS when resource constraints or other considerations impede an independent time-use survey.
Quick guide to understanding the impact of the new statistical standards on ILOSTAT databases
This quick guide explains the differences between the 13th and 19th ICLS standards, the impact of the revisions on headline indicators, and how the ILO handles this on ILOSTAT.

Global review of impacts of the COVID-19 pandemic on labour force surveys and dissemination of labour market statistics
In March 2021, the ILO undertook a global survey of national data producers to understand the impacts of the pandemic on their statistical operations particularly in the domain of labour statistics.
COVID-19 impact on labour market statistics
The restrictions necessary to combat COVID-19 pose a huge obstacle to data collection operations, precisely when there is a massive increase in demand for information. The ILO reached out to national data producers to understand the impacts of the pandemic on their statistical operations particularly in the domain of labour statistics. Last update: May 2020