Database descriptions, statistical standards (resolutions and guidelines), and guides and manuals – all the metadata to better understand the labour statistics presented on ILOSTAT.
Access all ILOSTAT data, including detailed cross-tabulations and special requests not made available through other data tools. Recommended for researchers!
Quickly find, filter, pivot, map and download data in various formats.
Learn more about the ILO’s programme of methodological research to identify and promote good practices in the collection and reporting of labour statistics.
The ILO seeks partners to improve the production and dissemination of labour statistics for better evidence-based policy. See our current partnerships.
The COVID-19 pandemic, along with the associated lockdowns, mobility restrictions and physical distancing rules, has not only led to a significant increase in unemployment and considerable income losses for many people, but has also altered the spending patterns of consumers and the level of price inflation that they face. In particular, the lockdown measures have affected the supply of and demand for certain products and, hence, their prices.
Since the beginning of the pandemic, an increasing number of people have lost their jobs or been obliged to work fewer hours (whether from home or otherwise), thereby experiencing a drop in their income. Consequently, the demand for many non‑essential goods and services has plummeted.
The initially very sharp fall in demand led to a decrease in the prices of some items, such as fuel, in the “basket” of goods and services used to calculate the consumer price index (CPI). As a result, consumer price inflation slowed down at the global level from about 4 per cent in the first quarter of 2020 to about 2.5 per cent in the second quarter. As lockdown measures were subsequently eased, consumer price inflation picked up slightly but still remained below the pre‑pandemic level. In August 2020, the prices of all goods and services were on average 2.7 per cent higher than in August 2019.
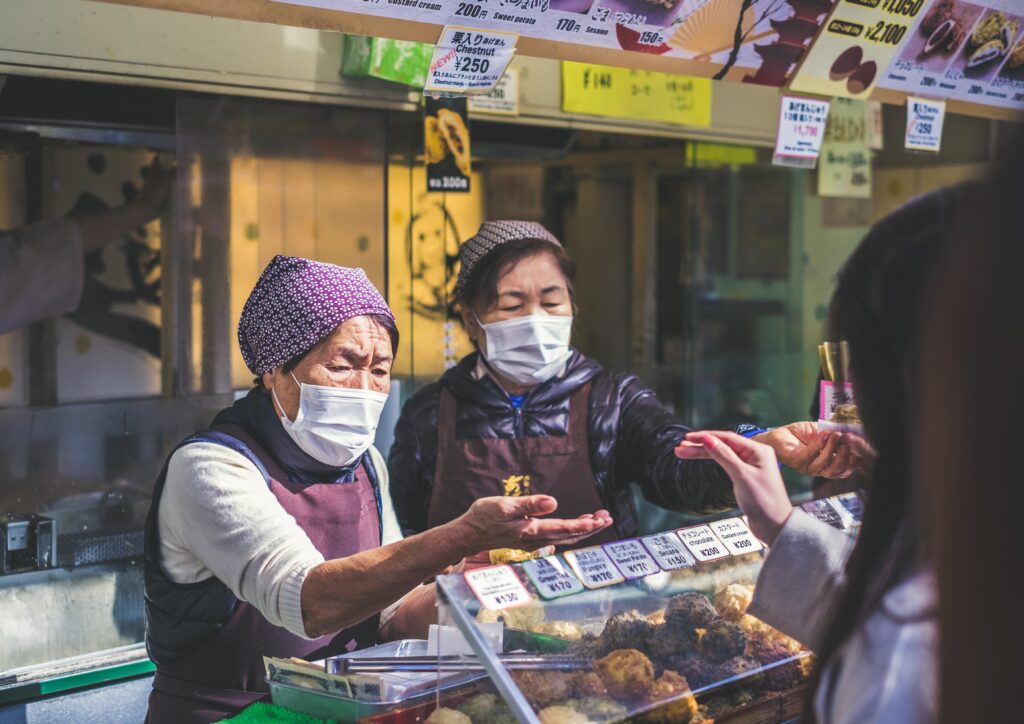
On the other hand, owing to COVID-19-related supply disruptions and the strong demand from consumers stockpiling food and medical supplies, but also personal care products, cleaning products and toilet paper, the prices of these goods have increased substantially. As can be seen in the chart below, the food component of the CPI has increased at a much faster rate than the overall CPI in all regions of the world. Globally, in August 2020, the prices of food products were on average 5.5 per cent higher than in August 2019.
Increases in food prices can have a major impact on the living standards of lower‑income households, which generally spend most of their income on food. Even a small increase can confront the members of such households with difficult decisions. Rising food prices and job losses triggered by the COVID-19 pandemic have the potential to undermine progress towards the Sustainable Development Goals and could even spark social unrest.
Food price increases correspond to the timing of the COVID-19 outbreaks in each region
Looking at food price trends in different regions, it becomes clear that food prices started to increase in Central and Southern Asia and in Eastern and South-Eastern Asia as from January 2020, and a few months later in the rest of the world. This may be related to the timing of the COVID-19 outbreaks in the various regions: many Asian countries were hit earlier than countries in Europe and Northern America and elsewhere.
In Eastern and South-Eastern Asia, the food prices inflation increased from 5.2 per cent in December 2019 to 9.3 per cent in January 2020. In Europe and Northern America, the food prices inflation increased from 1.9 per cent in March 2020 to 3.8 per cent in April 2020, when the lockdown measures were introduced. Similar patterns were observed in all other regions.
Methodology
The consumer price index (CPI) measures the average change over time in the prices of goods and services that a typical household consumes, such as food, beverages, tobacco, clothing, housing, fuels, household appliances, transport, health and telecommunications. For more information, see the topic page.
Regional estimates of consumer price inflation are calculated as a weighted geometric average of national price indices, with the weights being the respective countries’ estimated gross domestic product in 2017 in current dollars based on purchasing power parity (available from the World Bank). The regional CPI estimates are based on data for all countries for which CPI series are available for the period from January 2019 to August 2020.
Regional estimates of the CPI and the number of COVID-19 cases are calculated for the official country groupings (geographical regions) used by the United Nations in reporting on the indicators for the Sustainable Development Goals (SDGs). These differ from the regions and subregions presented on ILOSTAT.
SDG country grouping
Number of countries and territories with available CPI data
Central and Southern Asia
11
Eastern and South-Eastern Asia
17
Europe and Northern America
41
Latin America and the Caribbean
33
Northern Africa and Western Asia
20
Oceania
7
Sub-Saharan Africa
43
World
172
Data on confirmed new COVID-19 cases per month and population are from Our World in Data.